
Visualizing Points, Lines, and Planes
Loading the math board and drawing, please wait…
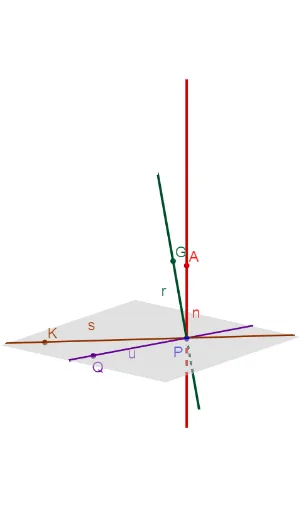
This GeoGebra example offers an interactive visualization of points, lines, and planes, enabling users to explore fundamental geometric figures and their relationships. Key mathematical concepts include geometry, coordinate geometry, functions (e.g., hyperbola), and geometric transformations. The construction employs GeoGebra commands such as Line, Plane, and OrthogonalLine to create objects like points (B, C, P, Q), lines (d, e, u, r, s), planes (G, K, n), and text annotations. It is designed for educational use in high school or college-level geometry and analytic geometry courses, promoting hands-on learning of spatial concepts.
GeoGebra Commands & Parameters
Line(B, C) → dPlane((0, 0, 0), (1, 0, 0), (0, 1, 0)) → eLine(Q, P) → uLine(G, P) → rLine(K, P) → sOrthogonalLine(P, e) → n
AI Drawing Prompt Reference
Draw a point P, and from P, draw two lines u and r on planes e and G respectively. Then, draw points Q and C, and draw line v through Q and P, and line s through P and K. Finally, draw a line n perpendicular to plane e through point P.
The prompt above was compiled from the original drawing commands and is for reference only.