
Different Prices Task
Loading the math board and drawing, please wait…
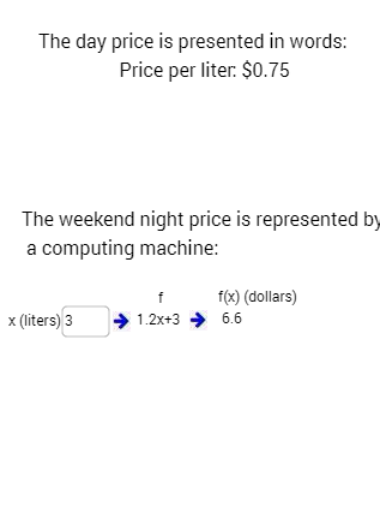
This example demonstrates the relationship between different prices, involving power functions. Using GeoGebra commands such as TextField, Point, Line, etc., specific geometric figures can be constructed. Suitable for high school mathematics education.
GeoGebra Commands & Parameters
Textfield(a) → InputBox1Point(xAxis) → GPoint(xAxis) → HLine(G, H) → fPoint(yAxis) → IPoint(yAxis) → JLine(I, J) → gOrthogonalLine(K, g) → hOrthogonalLine(K, h) → iSegment(L, K) → jPolygon((0, 0), (0, 10), (8, 10), (8, 0)) → poly1, k, l, m, nTableText({{A1, B1}, {A2, B2}, {A3, B3}, {A4, B4}, {A5, B5}}, "|_") → text9Textfield(c) → InputBox2Point(j) → M