
Dice Roll Simulation by Lew W. S.
Loading the math board and drawing, please wait…
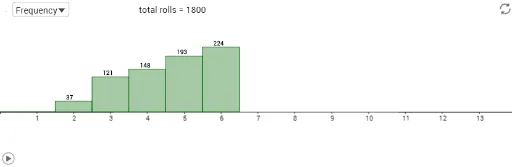
This example demonstrates the distribution of sums when rolling one, two, or three standard dice. It involves core math concepts like probability & statistics, random variables, and bar charts. Constructed using GeoGebra commands/objects such as Sequence, SelectedIndex, If, and BarChart. Suitable for high school students learning probability statistics or for classroom demonstrations.
GeoGebra Commands & Parameters
Sequence(Element[freq, k], k, 1, (6 * dice) + 1) → freq2Sequence(Element[freq2, k] / n, k, 1, Length[freq2]) → relFreqSelectedIndex(graphMenu) → graphTypeIf(n ≟ 0, 0, Max[freq]) → fMaxSequence(k - 1, k, 1, (6 * dice) + 1) → diceSumBarChart(diceSum, relFreq) → relFreqChartIf(n ≟ 0, 0, Max[relFreq]) → relMaxBarChart(diceSum, freq2) → freqChartSequence(Text["" + (Element[relFreq, k]), (k - 1.3, Element[relFreq, k] + step)], k, 1, Length[relFreq]) → lbl2Sequence(If[Element[freq2, k] > 0, Text["" + (Element[freq2, k]), (k - 1.2, Element[freq2, k] + step)]], k, 1, Length[freq2]) → lbl