
Derivative Tracer: Dynamic Tangent and Derivative Visualization
Loading the math board and drawing, please wait…
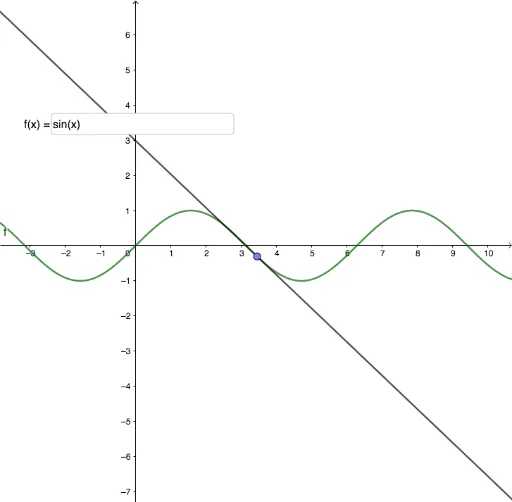
This interactive GeoGebra example demonstrates how the slope of the tangent line at a point on a function changes as the point moves, visually linking the derivative value to the tangent's steepness. The core mathematical concept is the geometric interpretation of the derivative as the slope of the tangent line, emphasizing the transition from secant to tangent and from average to instantaneous rate of change. The construction uses the Point command to create a movable point A on the function f, the Tangent command to generate the tangent line g at A, and the If command combined with a Textfield to display the derivative value dynamically. An InputBox and a button are included for interactive control, allowing users to input functions or adjust parameters. This resource is ideal for high school or introductory college calculus students, serving as a visual aid for understanding the derivative's meaning, and for teachers to demonstrate the concept in class.
GeoGebra Commands & Parameters
Point(f) → ATangent(A, f) → gIf(a, Derivative[f]) → f'Textfield(f) → InputBox1
AI Drawing Prompt Reference
Create an interactive function graphing tool that displays a function curve with its tangent line. In the center is a customizable function curve with a draggable point on it, showing how the tangent line's slope changes as the point moves. The tangent updates in real-time as the point moves, demonstrating the transition from secant to tangent. The derivative value at the current point is displayed to illustrate the geometric meaning of derivative as the slope of the tangent line. Include an input field for users to enter different function expressions.
The prompt above was compiled from the original drawing commands and is for reference only.