
Derivative of Logarithmic Function: Change Base a to Explore Slope
Loading the math board and drawing, please wait…
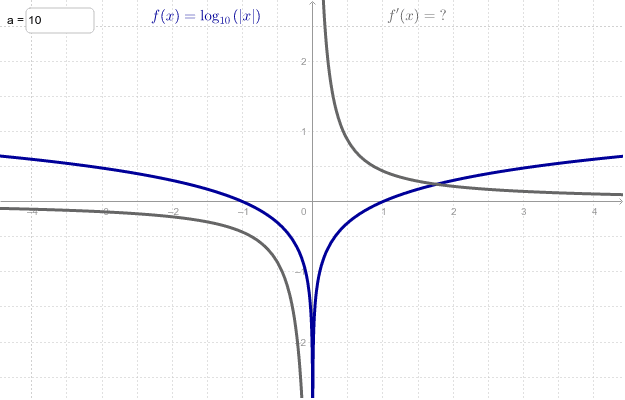
①This example dynamically demonstrates how the graph of a logarithmic function and its derivative change as the base a is adjusted via a slider or text input, with the tangent slope at a point displayed in real time.②The core mathematical concept is the derivative rule for logarithmic functions: if f(x)=log_a(x), then f'(x)=1/(x·ln a), where the base a directly affects the shape and magnitude of the derivative curve.③Construction highlights: using GeoGebra's Textfield to input the base a, creating the function f and its derivative f', and linking inputBox1, Text1, and Text2 to provide interactive control and dynamic text output, allowing users to change the base and instantly observe the resulting graphs and slope values.④This is suitable for high school to undergraduate calculus instruction, particularly for teaching logarithmic differentiation, the influence of the base on the derivative, and the relationship between a function and its derivative graph. It also serves well for self-study and classroom demonstrations.
GeoGebra Commands & Parameters
Textfield(a) → inputBox1
AI Drawing Prompt Reference
Draw a logarithmic function and its derivative with a variable base a, and display the tangent slope in real time by adjusting the base a through an input box. First, create an input box inputBox1 for entering the base a, then plot the logarithmic function f(x)=log_a(x) and its derivative f'(x)=1/(x·ln a), and finally link the input box to the function graph so that changes in the base a are reflected in the graph in real time.
The prompt above was compiled from the original drawing commands and is for reference only.