
Derivative Function by The Central Maths Hub
Loading the math board and drawing, please wait…
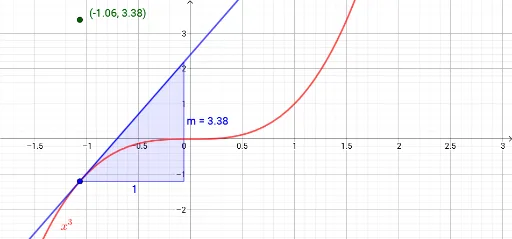
This example demonstrates how to plot the derivative function of a given function, dynamically showing the relationship between the slope of the tangent and the original function. Key math concepts include derivatives, tangent slopes, and function graph transformations. It uses GeoGebra commands/objects like Point, Tangent, Slope, Derivative, Textfield, and more. Suitable for high school calculus education to visually understand the geometric meaning and physical applications of derivatives.
GeoGebra Commands & Parameters
Point(A1) → ATangent(A, A1) → fSlope(f) → mDerivative(A1) → A2Textfield(A1) → InputBox1
AI Drawing Prompt Reference
Draw a function graph and dynamically show the slope of its tangent line, while also plotting the derivative function to visually demonstrate the relationship between the original function and its derivative. First, mark a point on the original function, then draw the tangent line at that point and calculate its slope. Next, find the derivative function based on the original function and mark a point at the corresponding position. Finally, use a text box to input the expression of the original function.
The prompt above was compiled from the original drawing commands and is for reference only.