
Derivative Demonstration by Kyle King
Loading the math board and drawing, please wait…
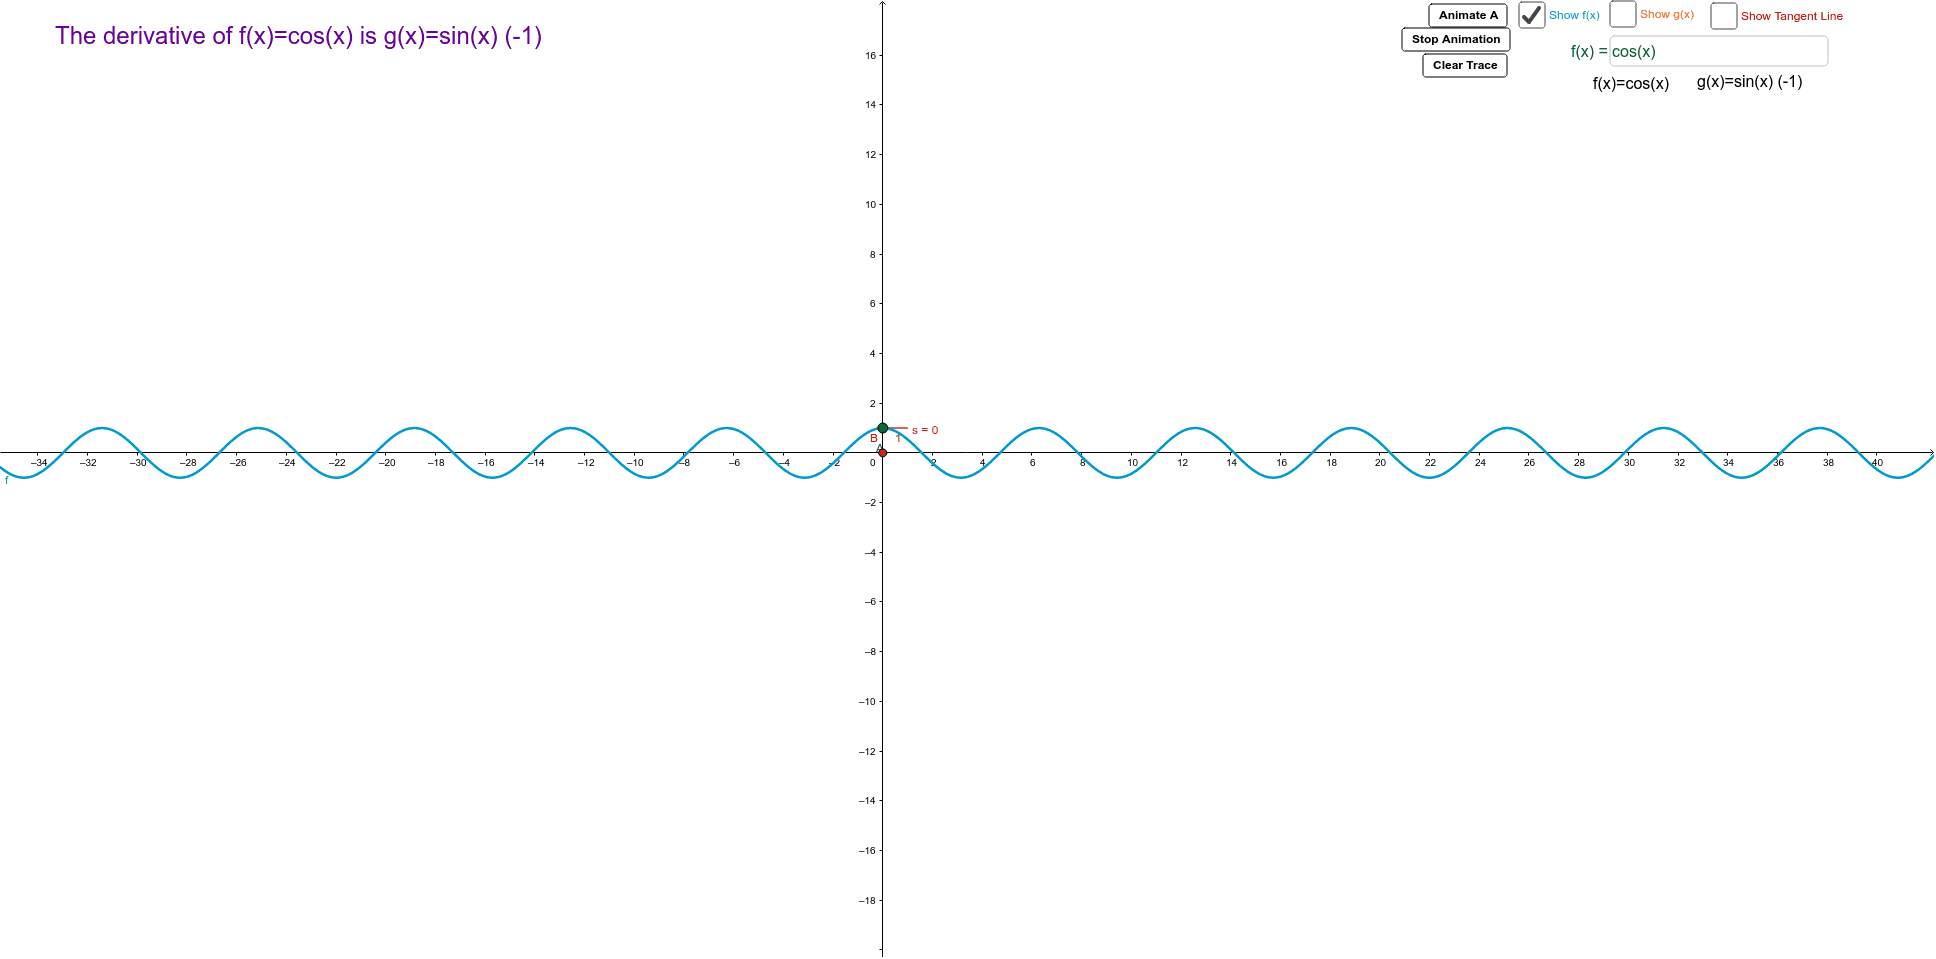
This GeoGebra applet demonstrates the concept of derivatives. By adjusting function f, users can observe changes in the tangent, slope, and derivative. The commands used include Point, Tangent, Slope, and Derivative. Suitable for high school mathematics education and learning calculus.
GeoGebra Commands & Parameters
Point(f) → ATangent(A, f) → tSlope(t) → sDerivative(f) → gTextfield(f) → inputBox1
AI Drawing Prompt Reference
Draw a function with its tangent line, slope, and derivative function displayed. Allow the user to adjust the original function to observe changes in the tangent's position, the slope value, and the derivative function's graph. The tangent line should touch the original function at a selected point, with the point of tangency marked. Display the slope value next to the tangent line. The derivative function's graph should reflect the trend of the original function and be clearly shown in the same coordinate system.
The prompt above was compiled from the original drawing commands and is for reference only.