
Poisson Distribution vs. Binomial Distribution
Loading the math board and drawing, please wait…
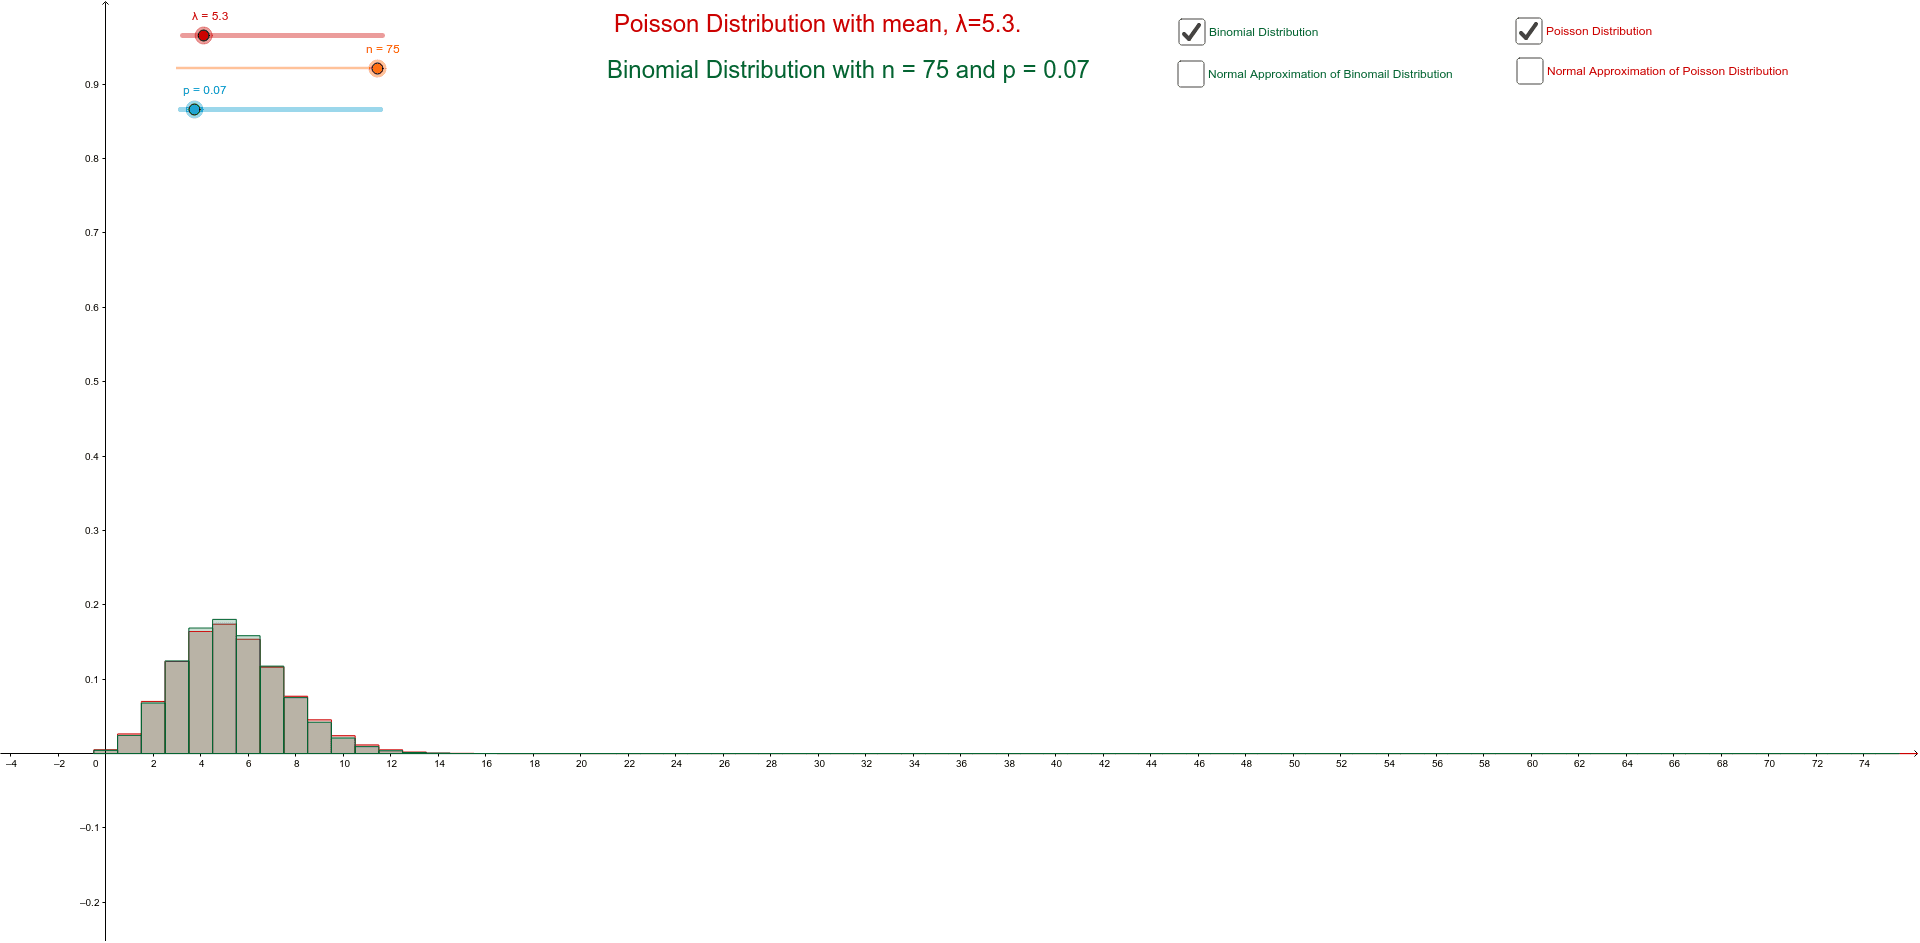
This applet demonstrates the changes in the graphs of Poisson and Binomial distributions by adjusting parameters. Key mathematical concepts include probability and statistics, specifically Poisson and Binomial distributions. GeoGebra commands used include Poisson and BinomialDist. Adjust parameters λ and n using sliders to observe the changes in the distribution curves. Suitable for high school and above students learning probability and statistics.
GeoGebra Commands & Parameters
Poisson(λ) → fNormal(λ, sqrt(λ), x) → NBinomialDist(n, p) → hNormal((n * p), sqrt(((n * p) * (1 - p))), x) → g