
Demonstration of System of Inequalities
Loading the math board and drawing, please wait…
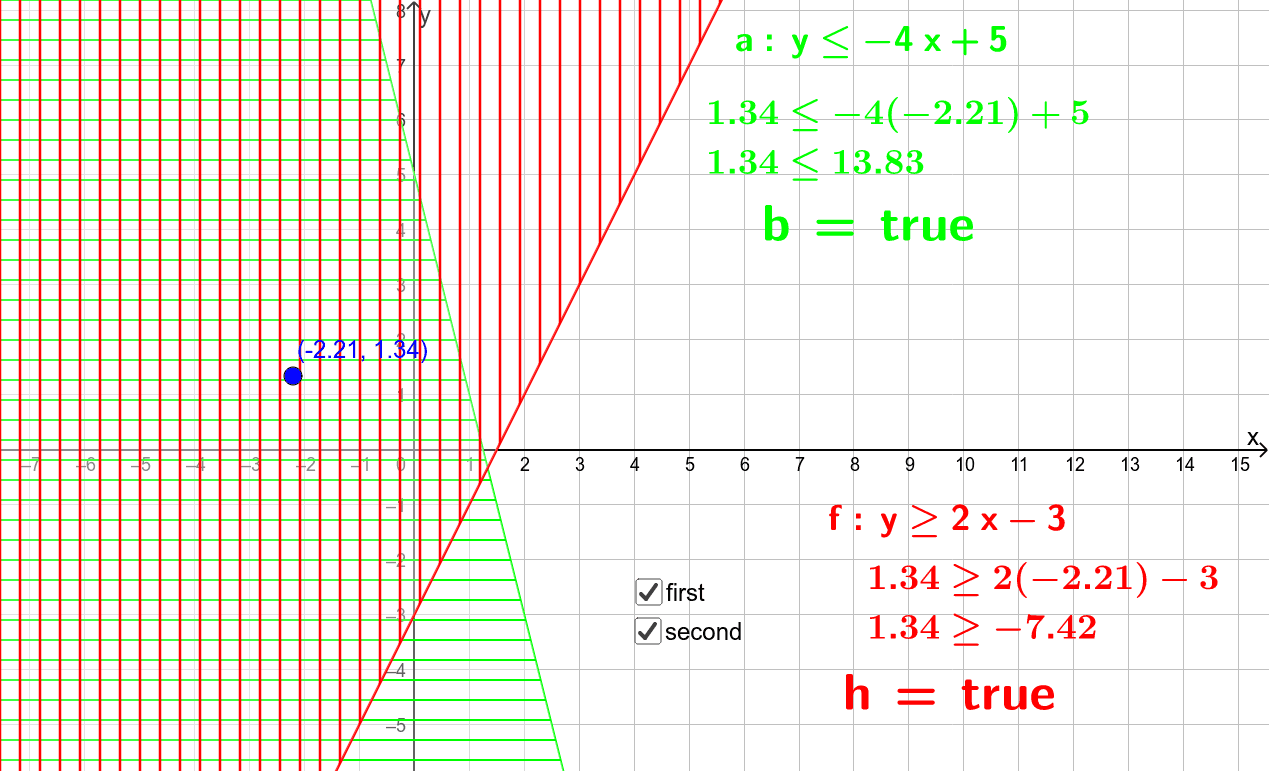
This example visually demonstrates the solution set of a system of inequalities in a 2D plane, highlighting the region where multiple inequalities are simultaneously satisfied. Key mathematical concepts include inequalities, vectors, similarity transformations, ellipses, and logarithmic functions. The GeoGebra construction utilizes commands and objects such as a, A, b, text1, text2, c, d, e, text3, f, text4, g, text5, h, text6, i, j for parametric representation and dynamic visualization. It is suitable for high school and advanced learners exploring interactions between complex functions, geometric transformations, and optimization problems.
GeoGebra Commands & Parameters
LaTeX(b, true, true) → text1LaTeX(a, true, true) → text2LaTeX(f, true, true) → text4LaTeX(h, true, true) → text6
AI Drawing Prompt Reference
Visualize the solution set of a system of inequalities in a 2D plane, highlighting regions where multiple inequalities overlap, and label key inequalities and parameters, showing relationships between vectors, similarity transformations, ellipses, and logarithmic functions, start with the inequality regions, then add parameter labels and mathematical expressions.
The prompt above was compiled from the original drawing commands and is for reference only.