
Geometric Mean ≤ Arithmetic Mean: A Dynamic Visual Proof
Loading the math board and drawing, please wait…
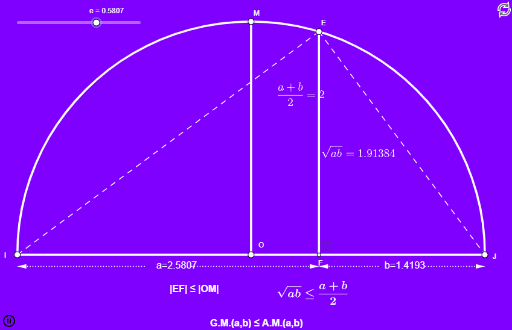
① This example dynamically demonstrates the classic inequality that the geometric mean (GM) of two positive numbers is always less than or equal to their arithmetic mean (AM), using a unit circle and vectors. ② Core mathematical concepts include arithmetic mean, geometric mean, AM-GM inequality, unit circle, vectors, right triangles, and area relationships. ③ Construction highlights: using GeoGebra commands such as Circle, Point, Polygon, Segment, OrthogonalLine, Intersect, Angle, and Vector to build the unit circle, relevant points, polygons, perpendicular lines, intersections, angles, and vectors, with text objects displaying numerical values and the inequality. ④ Suitable for high school and above, this serves as a geometric intuition for the AM-GM inequality and can be used in math competitions or pre-university courses.
GeoGebra Commands & Parameters
Circle((0, 0), 2) → cPoint(xAxis) → APoint(xAxis) → BPolygon(A, B, C, D) → çokgen1, a, b, c_1, dSegment((-2, 0), (2, 0)) → fSegment((0, 0), (0, 2)) → gSegment(E, (-2, 0)) → hSegment(E, (2, 0)) → iOrthogonalLine(E, f) → jIntersect(f, j) → FSegment(E, F) → kAngle(J, F, E) → αVector((-0.2 + x(F) / 2 + x(I) / 2, -0.1), (x(I), -0.1)) → uVector((0.2 + x(F) / 2 + x(I) / 2, -0.1), (x(F), -0.1)) → vVector((-0.2 + x(J) / 2 + x(F) / 2, -0.1), (x(F), -0.1)) → wVector((0.2 + x(F) / 2 + x(J) / 2, -0.1), (x(J), -0.1)) → l
AI Drawing Prompt Reference
Draw a circle centered at the origin with radius 2. Place two points on the horizontal diameter and construct a rectangle using these points and two points on the circle. From a point on the circle, drop a perpendicular to the diameter, marking the foot, and connect this point to both ends of the diameter to form two right triangles. Label an angle at the foot involving the circle point and an endpoint. Below the figure, add two pairs of arrow vectors representing the arithmetic mean and geometric mean of two numbers, with text showing their values and the inequality between them.
The prompt above was compiled from the original drawing commands and is for reference only.