
Domain and Range of a Function by Breck Jacobs
Loading the math board and drawing, please wait…
In collections
Chapter 3__Graphing Linear Functions
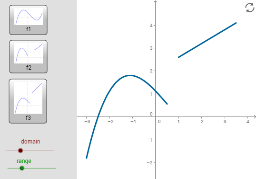
This example demonstrates how to graphically represent the domain and range of a function using GeoGebra. Key math concepts include functions, domain, range, and geometric constructions. It utilizes commands like If, Min, Max, Intersect, Vector, Defined, Segment, IndexOf, Polygon. Suitable for high school mathematics education or self-study to understand function properties and graphs.
GeoGebra Commands & Parameters
If(a, L, If[b, (1.5, 0), If[c, (1, 0)]]) → L1If(a, g1, If[b, g2, If[c, g3]]) → fMin(f, x(L1), rght) → mi11If(b, (0, 0), If[c, (0.5, 0), If[a, R]]) → R1Min(f, lft, x(R1)) → mig1Min(list2) → min_fMax(f, lft, x(R1)) → mag2Min(f, x(mag2), x(R1)) → mi_2Min(y(mi_2), x(mi11)) → MiEIntersect(f, j, x(mag2), x(mi_2)) → EIntersect(d, xAxis) → CIntersect(f, d, (-3, -1.7999999999999998)) → AVector(A, B) → uDefined(A) → eIf(x(L1) ≤ x1, If[x1 < x(R), B, R], L1) → end2Segment(L1, end2) → hIf(lft ≤ x1, If[x1 < x(R1), B, R1], L) → end1Segment(L, end1) → gIntersect(f, j, lft, x(mag2)) → DVector((x(L), f(x(L))), L) → vVector((x(R), f(x(R))), R) → wVector((x(L1), f(x(L1))), L1) → zVector((x(R1), f(x(R1))), R1) → lMax(f, x(L1), rght) → mag22Max(list1) → max_fVector((min_f, f(min_f)), (0, f(min_f))) → rIf(min_f ≤ y1, If[y1 < y(mag2), M, (0, y(mag2))], Y_l) → endv1Segment(Y_l, endv1) → tVector(D, (0, y(D))) → nIndexOf(max_f, list1) → Ind_maIndexOf(min_f, list2) → Ind_miVector(MiPt, (0, y(MiPt))) → v_1Vector(MaPt, (0, y(MaPt))) → u_1If(L1 ≠ L, Intersect[f, j, x(L1), rght], Intersect[f, j, x(mi_2), rght]) → FVector(E, (0, y(E))) → pVector(F, (0, y(F))) → qIf(min_f ≤ y1, If[y1 < y(mag2), (0, y(E)), (0, y(mag2))], (0, MiE)) → endv2Segment((0, MiE), endv2) → a_1If(min_f ≤ y1, If[y1 < y(mag22), (0, y(F)), (0, y(mag22))], (0, f(L1))) → endv3Segment((0, y(L1)), endv3) → b_1Segment((0, f(L1)), endv3) → c_1Polygon(Corner[1], (x(Corner[1]) + (0.3 * Distance[Corner[1], Corner[2]]), y(Corner[1])), (x(Corner[4]) + (0.3 * Distance[Corner[1], Corner[2]]), y(Corner[4])), Corner[4]) → poly1, d_1, e_1, f_1, g_1
AI Drawing Prompt Reference
Draw a function graph and indicate its domain and range. First, draw the function graph. Then, use conditional statements to determine the boundary points L1 and R1 for the domain. Find the function values at these boundary points and construct horizontal line segments to represent the range. Finally, use conditional statements and vectors to construct the boundary segments for the domain and range, and the intersection points between them.
The prompt above was compiled from the original drawing commands and is for reference only.