
Demonstration of Linear Functions in 2-D
Loading the math board and drawing, please wait…
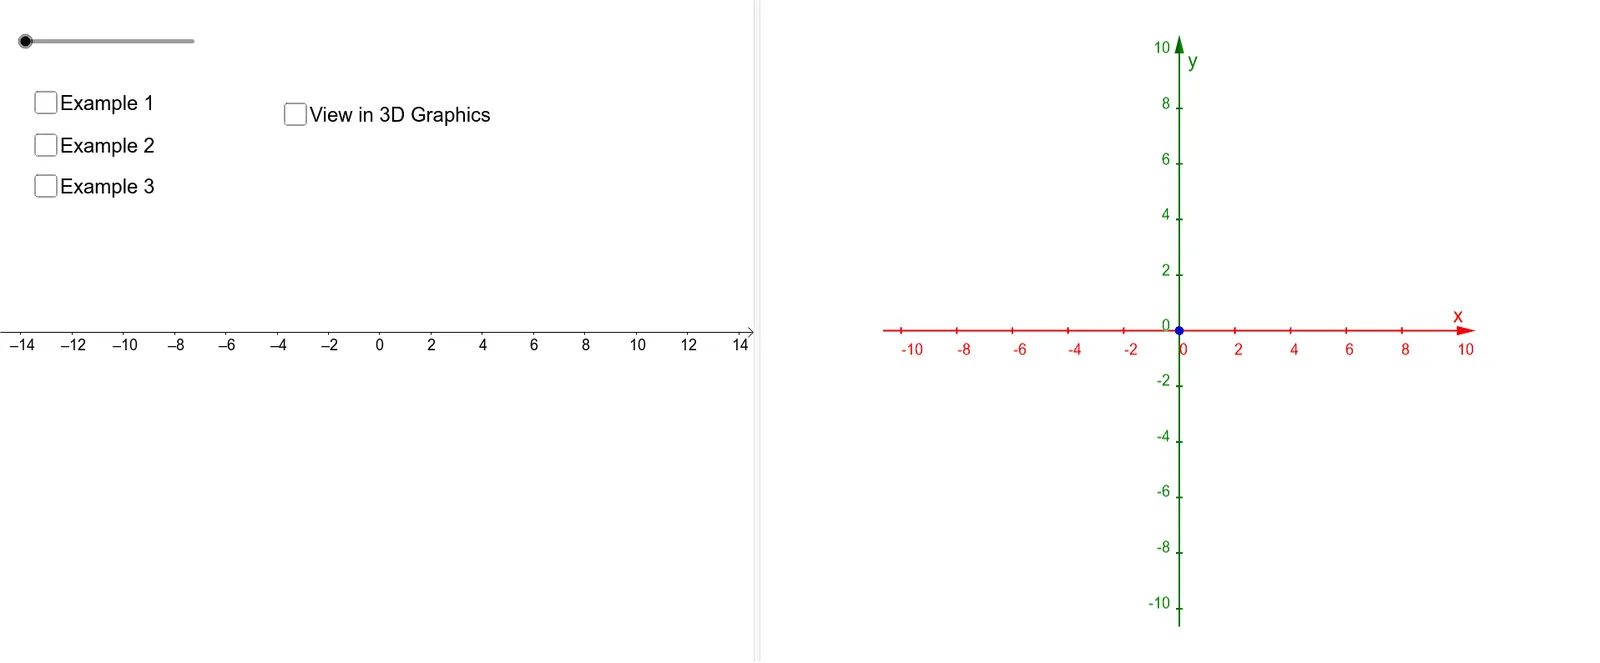
This example dynamically illustrates the graph of 2-D linear functions and their related properties, visually showing the relationship between the function's graph and coefficient changes. Core mathematical concepts include linear functions, coordinate geometry, geometric construction, reflection, and special points. Construction highlights from the command summary involve Segment and various point/functional objects (k, a, b, c, D, A, B, C, E, F, G, h, i, j, l, f_1, g_1, f_2, g_2, f_3, g_3, f, g, H, I, d, m, n). Suitable for high school mathematics instruction or student self-exploration of linear function properties.
GeoGebra Commands & Parameters
Segment(A, D) → hSegment(A, E) → iSegment(A, F) → jSegment(A, G) → lSegment(A, B) → mSegment(A, C) → n
AI Drawing Prompt Reference
Create a central point and six additional points placed at various locations. Draw line segments from the central point to each of the six surrounding points, forming six distinct connections. This arrangement illustrates the geometric construction of linear functions, showing how a primary point relates to multiple other points through straight line segments. The visual emphasizes the spatial relationships and coordinate geometry underlying linear function graphs, suitable for high school mathematics instruction or self‑exploration.
The prompt above was compiled from the original drawing commands and is for reference only.