
Definite Integral: Upper and Lower Sums Visualization
Loading the math board and drawing, please wait…
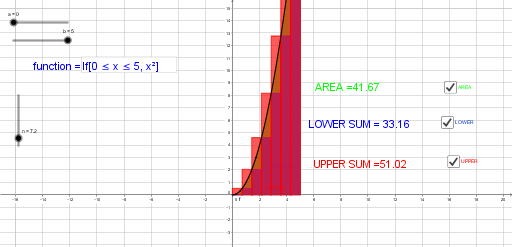
This GeoGebra example dynamically visualizes the concepts of upper and lower Riemann sums for a definite integral. It shows a function curve over an interval [a,b] partitioned into n subintervals, where rectangles are constructed using right endpoints (upper sum) and left endpoints (lower sum) to approximate the integral. The core mathematical concepts include definite integrals, Riemann sums, interval partitioning, limit approximation, and the geometric meaning of upper and lower sums. Construction details: The example uses GeoGebra commands such as Integral to compute the exact integral value, LowerSum and UpperSum to generate the lower and upper rectangle sums, Textfield and InputBox1 for interactive input of endpoints a, b and partition number n, along with text objects (text1, text2, text3) to display numerical results. It is suitable for high school seniors or early university calculus students to understand the geometric foundation of the definite integral, and serves as an effective classroom demonstration tool to observe how both sums converge to the integral as n increases.
GeoGebra Commands & Parameters
Integral(f, a, b) → cLowerSum(f, a, b, n) → dTextfield(f) → InputBox1UpperSum(f, a, b, n) → e
AI Drawing Prompt Reference
Draw a function curve over an interval [a,b] divided into n equal subintervals. Construct a set of rectangles using left endpoints to form the lower sum (shorter rectangles) and another set using right endpoints for the upper sum (taller rectangles). Fill the two rectangle sets with different colors to visually compare their approximations to the area under the curve. Also show the exact integral area as the region between the curve and the x-axis. Display three numerical values: the exact integral, the lower sum, and the upper sum. Include input boxes for adjusting a, b, and n, so that as n increases, both sums converge toward the exact integral.
The prompt above was compiled from the original drawing commands and is for reference only.