
Theft Data Histogram by Shepherd Magwegwe
Loading the math board and drawing, please wait…
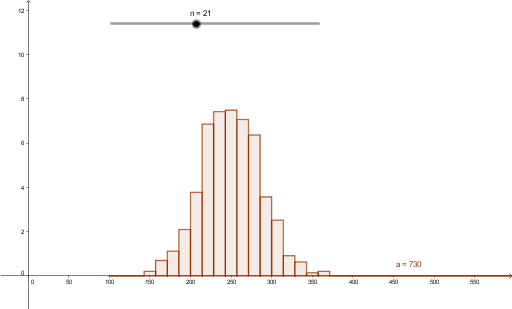
This example demonstrates how to use a histogram to visualize the distribution of theft data. It involves core mathematical concepts such as histograms, probability & statistics, and data visualization. The construction uses the GeoGebra command 'Histogram'. It is suitable for high school students learning probability & statistics and data analysis.
GeoGebra Commands & Parameters
Histogram(list2, list1, true, 1) → a