
Cubing Function with Sliders
Loading the math board and drawing, please wait…
In collections
Graph Transformations
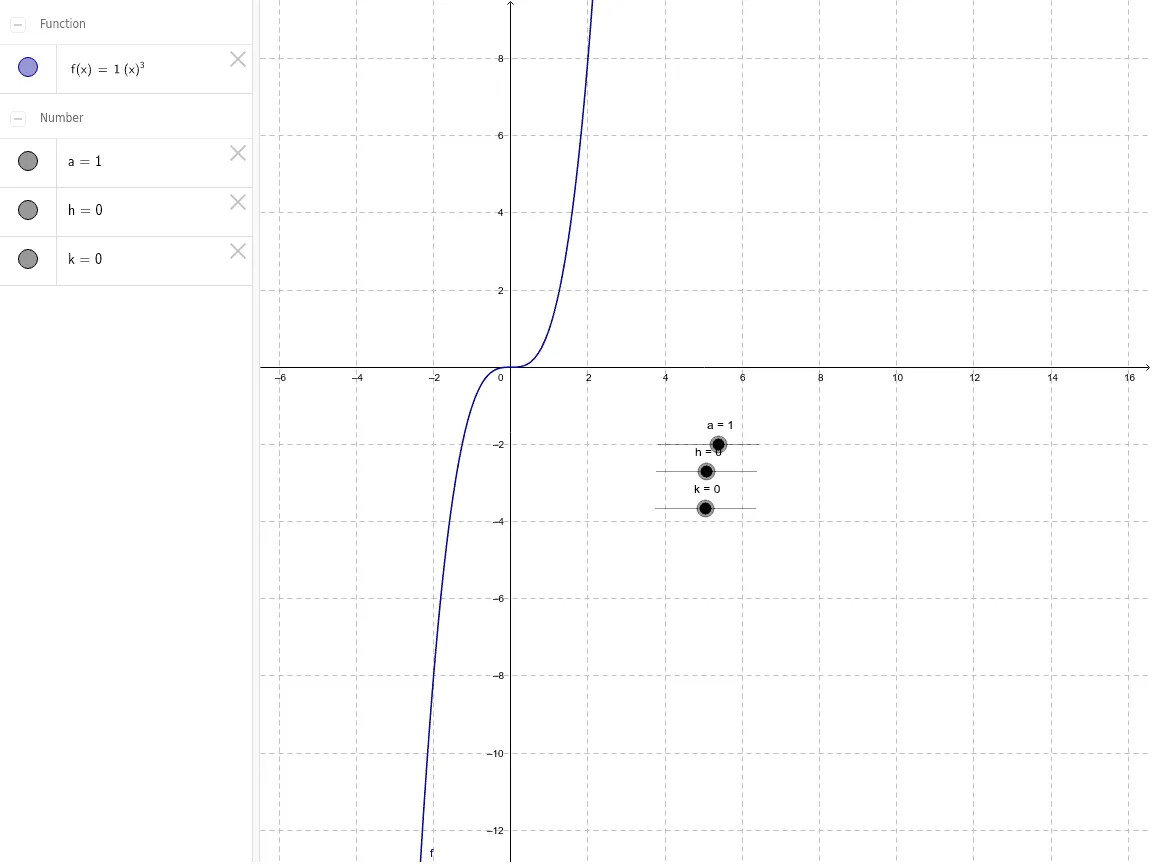
This example demonstrates the changes in the graph of a cubic function, involving the concept of polynomial functions. By adjusting sliders a, h, and k, the graph of f(x) = a(x-h)^3 + k can be observed. The GeoGebra commands used in the construction include objects a, h, k, and f. Suitable for high school mathematics education, it helps students understand the properties and transformations of cubic functions.
GeoGebra Commands & Parameters
Numeric a(1.0)Numeric h(0.0)Numeric k(0.0)f(x) = a * (x + h)^(3) + k
AI Drawing Prompt Reference
Draw a graph of a cubic function defined by f(x) = a(x-h)^3 + k, with three adjustable sliders for parameters a, h, and k. Initially, set a=1, h=0, and k=0, so the curve is the standard y = x^3, passing through the origin with central symmetry. The sliders control the vertical stretch/reflection (a), horizontal shift (h), and vertical shift (k). As the sliders are moved, the curve transforms accordingly, illustrating translations and scaling of cubic functions. The plot should include coordinate axes and the curve, suitable for high school math education.
The prompt above was compiled from the original drawing commands and is for reference only.