
Square Root Function with Sliders
Loading the math board and drawing, please wait…
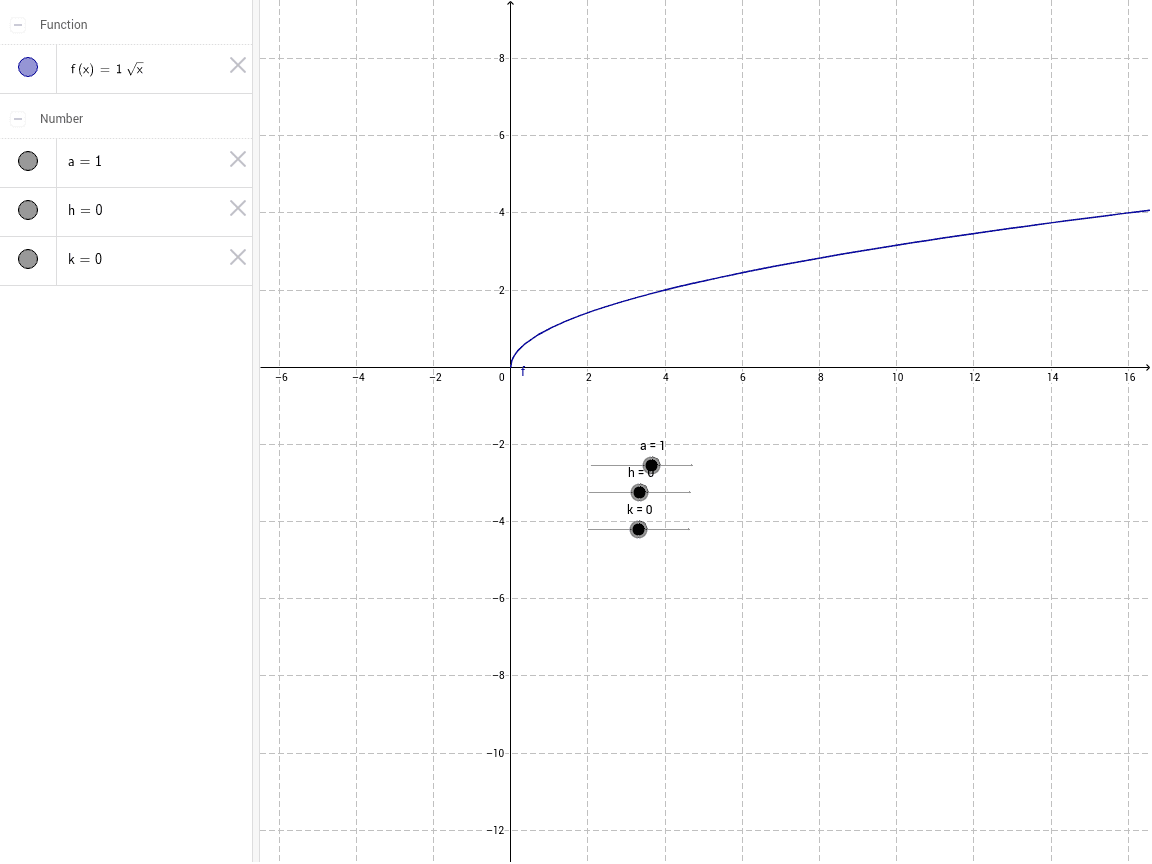
This GeoGebra example demonstrates the graph of the square root function f(x)=a√(x-h)+k, with sliders a, h, and k controlling vertical stretch, horizontal shift, and vertical shift in real time. It visually shows how changing parameters transforms the basic square root curve, including its domain and range. Core mathematical concepts include square root functions, function transformations (translation and scaling), and the relationship between parameters and graph features. The construction uses three slider objects (a, h, k) and a function definition f, allowing dynamic exploration. This resource is suitable for middle and high school mathematics, particularly for teaching function transformations, and can be used in classroom demonstrations or student-led inquiry to build intuitive understanding of how parameters affect graphs.
GeoGebra Commands & Parameters
Numeric a(1.0)Numeric h(0.0)Numeric k(0.0)f(x) = a * sqrt(x + h) + k
AI Drawing Prompt Reference
Draw a Cartesian coordinate plane with the graph of a square root function. The function is f(x) = a times the square root of (x plus h) plus k, where a, h, and k are adjustable slider parameters. Initially, a is 1, h is 0, and k is 0, so the curve starts at the origin and extends to the upper right. Include three horizontal sliders to control vertical stretch, horizontal shift, and vertical shift, and let the curve update in real time as the sliders move. The image should clearly show the curve, axes, and slider positions to illustrate how parameter changes affect the graph's shape and location.
The prompt above was compiled from the original drawing commands and is for reference only.