
Cosine-Powered Rose Curves: Parametric Equation Visualization
Loading the math board and drawing, please wait…
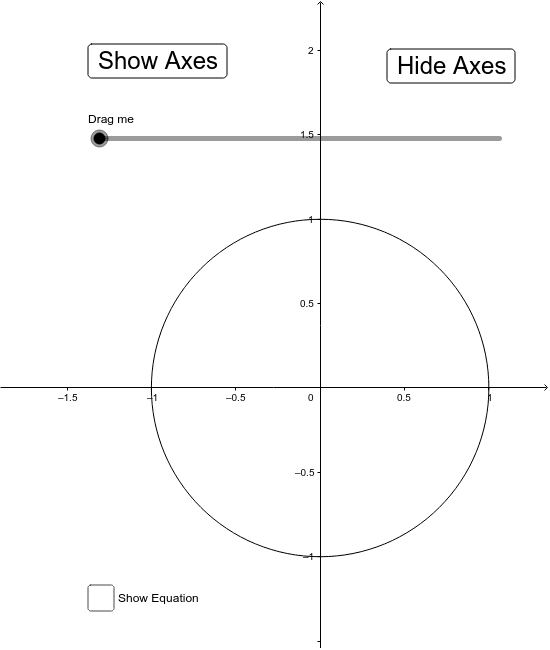
This GeoGebra example demonstrates how to create multiple-leafed rose curves using cosine functions and shows their relationship to the unit circle. By adjusting parameter k, users can observe the formation pattern: when k is even, the curve has 2k petals; when k is odd, it has k petals. Construction uses the CurveCartesian command with parametric equations x=a*cos(k*θ)*cos(θ), y=a*cos(k*θ)*sin(θ); slider parameters control amplitude a and frequency k; interactive buttons enable dynamic exploration. Key concepts include trigonometric functions, polar-coordinates-to-Cartesian conversion, and parametric curve generation. Suitable for high school trigonometry lessons and college-level parametric equations courses.
GeoGebra Commands & Parameters
CurveCartesian((cos((a * t)) * cos(t)), (cos((a * t)) * sin(t)), t, 0, 6.28319) → b
AI Drawing Prompt Reference
Draw a rose curve generated by cosine functions, adjusting parameter k to observe the pattern of petal numbers. Set parameter a to control the amplitude of the curve, and use parameter t ranging from 0 to 2π to generate the curve. When k is even, the curve has 2k petals; when k is odd, it has k petals.
The prompt above was compiled from the original drawing commands and is for reference only.