
Cosine Function
Loading the math board and drawing, please wait…
In collections
geometriadinamica.es
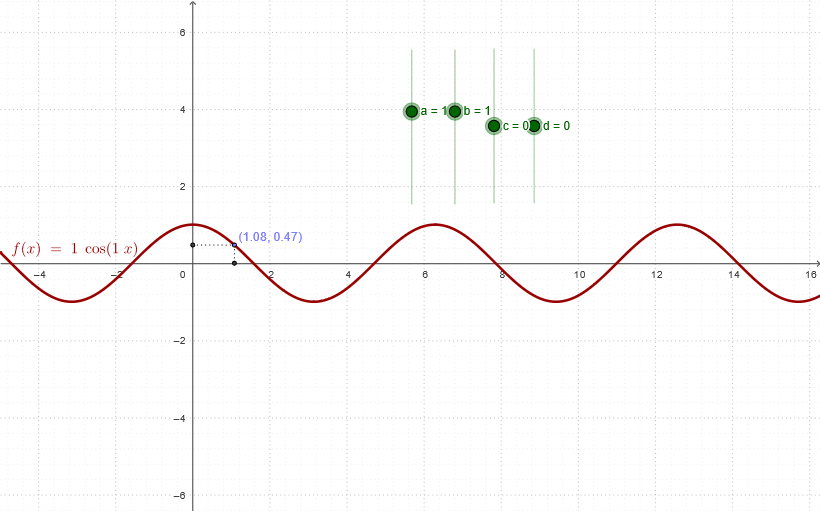
This example demonstrates the graph of the cosine function. It involves the core mathematical concept of trigonometric functions. Using GeoGebra commands such as Point and Segment, the graph of the cosine function is constructed. Suitable for high school mathematics education and learning.
GeoGebra Commands & Parameters
Point(f) → ASegment(C, A) → eSegment(A, B) → g
AI Drawing Prompt Reference
Draw a graph of the cosine function. The graph includes a starting point A and an ending point B, along with a line segment g connecting A and B. The line segment g forms a straight line. The graph shows the basic shape of the cosine function, where the curve changes from A to B. The construction order is to first determine points A and B, then draw line segment g, and finally display the graph to show the trend of the function.
The prompt above was compiled from the original drawing commands and is for reference only.