
Correlation Exploration
Loading the math board and drawing, please wait…
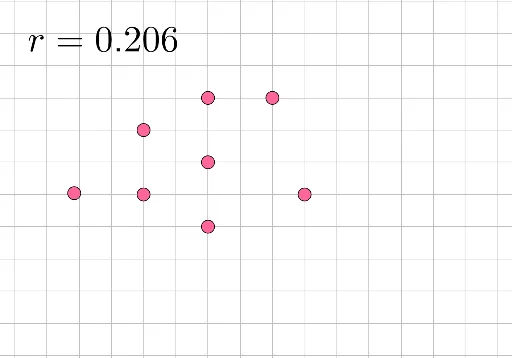
Explore the meaning of the correlation coefficient r. This guided discovery lesson helps students understand the concept of the correlation coefficient without using the term directly. By adjusting points A and B, observe the changes in the scatter plot and the value of r. The construction uses the PMCC command and involves points and lines. Suitable for high school mathematics education.
GeoGebra Commands & Parameters
PMCC(l1) → a
AI Drawing Prompt Reference
Create a scatter plot with a trend line, allowing two points to be adjusted to observe changes in the scatter plot and the trend line. The scatter plot and trend line should be clearly connected, and the correlation coefficient value should dynamically change as the points are adjusted to show their relationship.
The prompt above was compiled from the original drawing commands and is for reference only.