
Correlation Coefficient Sliders
Loading the math board and drawing, please wait…
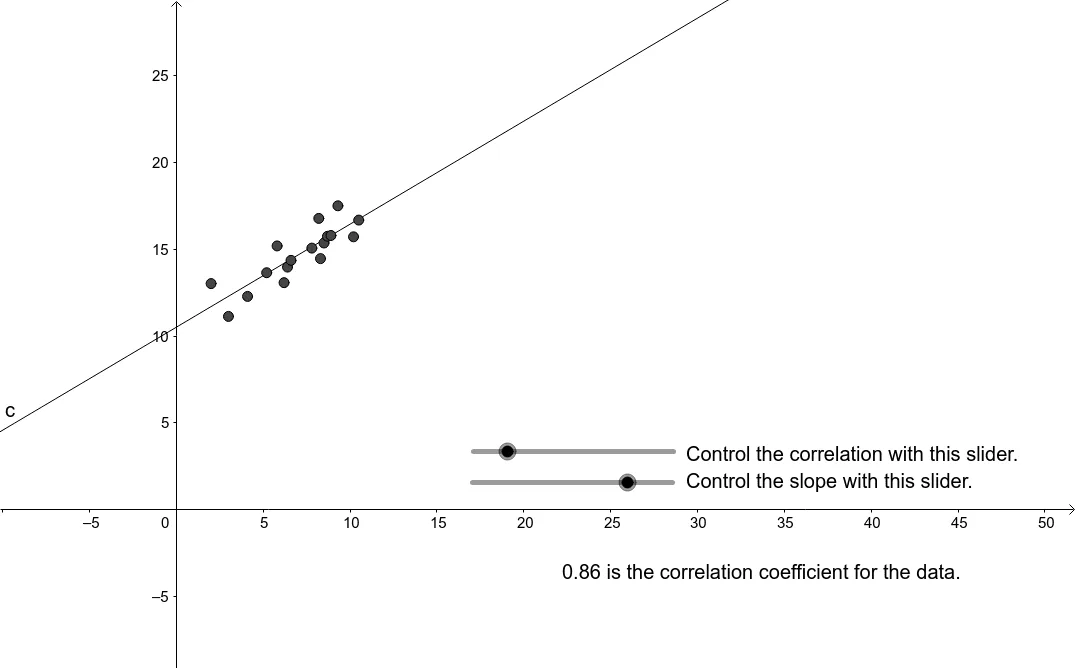
This applet demonstrates the dynamic relationship between data points, correlation coefficient, and best-fit line by using sliders to adjust data. Key math concepts include correlation coefficient, linear regression, scatter plot, and best-fit line. Constructed using GeoGebra commands PMCC and FitLineY, with objects like d, A1-A17, C1-C17, B1-B4 for data manipulation. Ideal for high school probability & statistics, helping students visualize the connection between correlation and data distribution, and the meaning of best-fit lines.
GeoGebra Commands & Parameters
PMCC({A, B, C, D, E, F, G, H, I, J, K, L, M, N, O, P, Q}) → bFitLineY({A, B, C, D, E, F, G, H, I, J, K, L, N, O, P, Q}) → c
AI Drawing Prompt Reference
Create a scatter plot with seventeen draggable data points on a coordinate plane. As you drag these points, a best-fit line updates dynamically, and a correlation coefficient value changes in real time to reflect the spread and clustering of the points. Include slider controls to adjust the data points, helping visualize how the distribution affects the correlation coefficient and the slope and position of the fitted line. The layout should clearly show the interactive relationship among the points, the line, the coefficient value, and the sliders.
The prompt above was compiled from the original drawing commands and is for reference only.