
Correlation Coefficient as a Slope
Loading the math board and drawing, please wait…
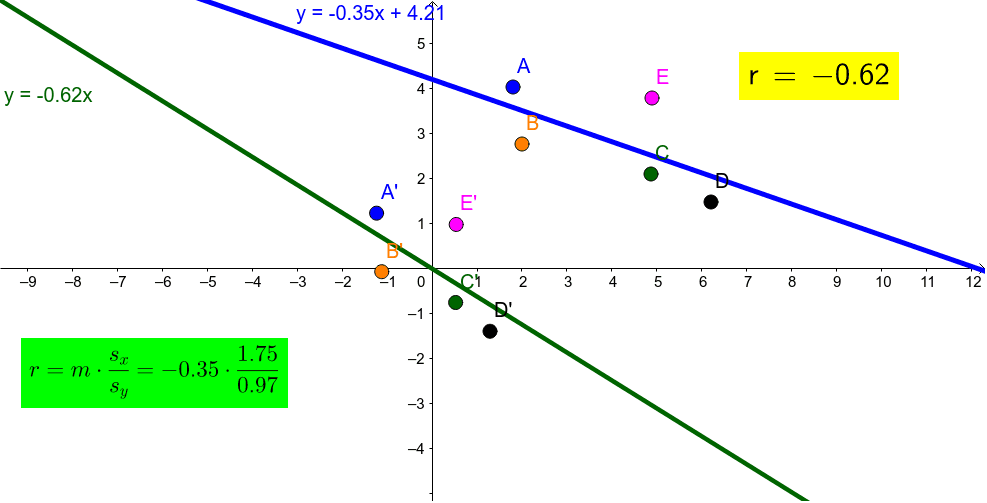
This example uses GeoGebra to demonstrate the concept of the correlation coefficient. By analyzing the relationship between points A, B, C, D, and E, we explore the connection between the correlation coefficient and slope. Commands used include FitLineY, PMCC, LaTeX, Slope, SDX, and SDY. Suitable for high school math education, helping students understand the geometric meaning of the correlation coefficient.
GeoGebra Commands & Parameters
FitLineY({A, B, C, D, E}) → aPMCC({A, B, C, D, E}) → rLaTeX(r, true, true) → text1FitLineY({AA, BB, CC, DD, EE}) → bSlope(a) → mSDX({A, B, C, D, E}) → dSDY({A, B, C, D, E}) → e
AI Drawing Prompt Reference
Draw a graph with five points representing data points. Connect these points to form a line, which relates to the distribution of the data. Calculating the slope of these points helps understand the relationship between the data. The graph should include the points, the connecting line, and the slope value to show the correlation between the data points.
The prompt above was compiled from the original drawing commands and is for reference only.