
Correlation as the Cosine of an Angle
Loading the math board and drawing, please wait…
In collections
A Geometry Teacher Meets the Correlation Coefficient
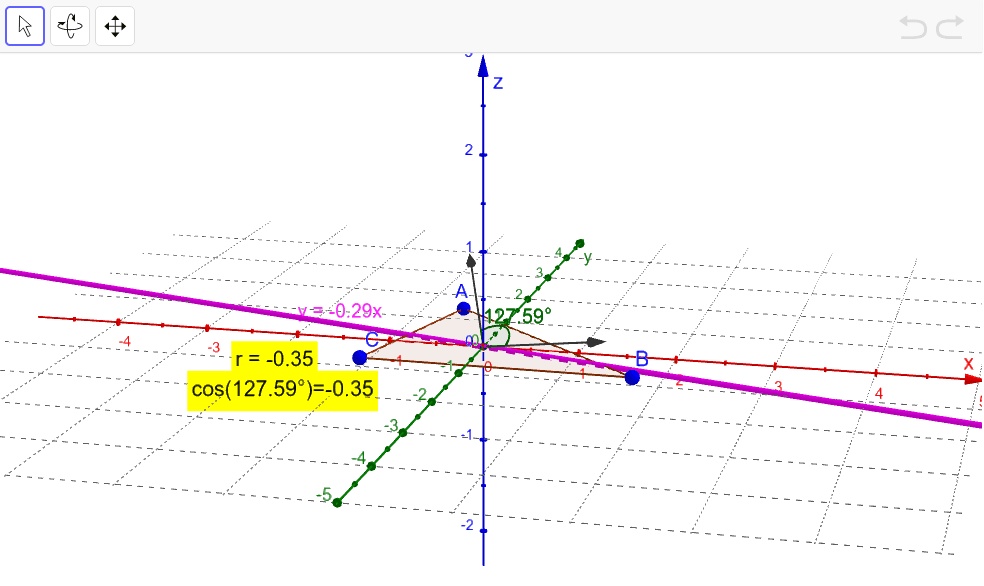
This example provides a new perspective on correlation. By standardizing the coordinates of points, the x-coordinates are represented as a vector and the y-coordinates as another vector. The cosine of the angle between these vectors represents the correlation. The construction involves commands such as Midpoint, Dilate, Polygon, Vector, Angle, PMCC, and FitLineY. Suitable for high school and above students learning about correlation and vectors.
GeoGebra Commands & Parameters
Midpoint(A, B) → C_1Dilate(C_1, -2, (0, 0)) → CPolygon(A, C, B) → poly1, b, a, c'Vector((x(A), x(B), x(C_1))) → uVector((y(A), y(B), y(C_1))) → vAngle((x(A), x(B), x(C_1)), (0, 0, 0), (y(A), y(B), y(C_1))) → αPMCC({A, B, C}) → rFitLineY({A, B, C}) → c
AI Drawing Prompt Reference
Draw a triangle ABC. Standardize the coordinates of points to represent x-coordinates as vector u and y-coordinates as vector v. Calculate the angle α between vectors u and v, and the Pearson correlation coefficient r for points A, B, and C. Draw a line c passing through points A, B, and C.
The prompt above was compiled from the original drawing commands and is for reference only.