
Correlation and Linear Regression
Loading the math board and drawing, please wait…
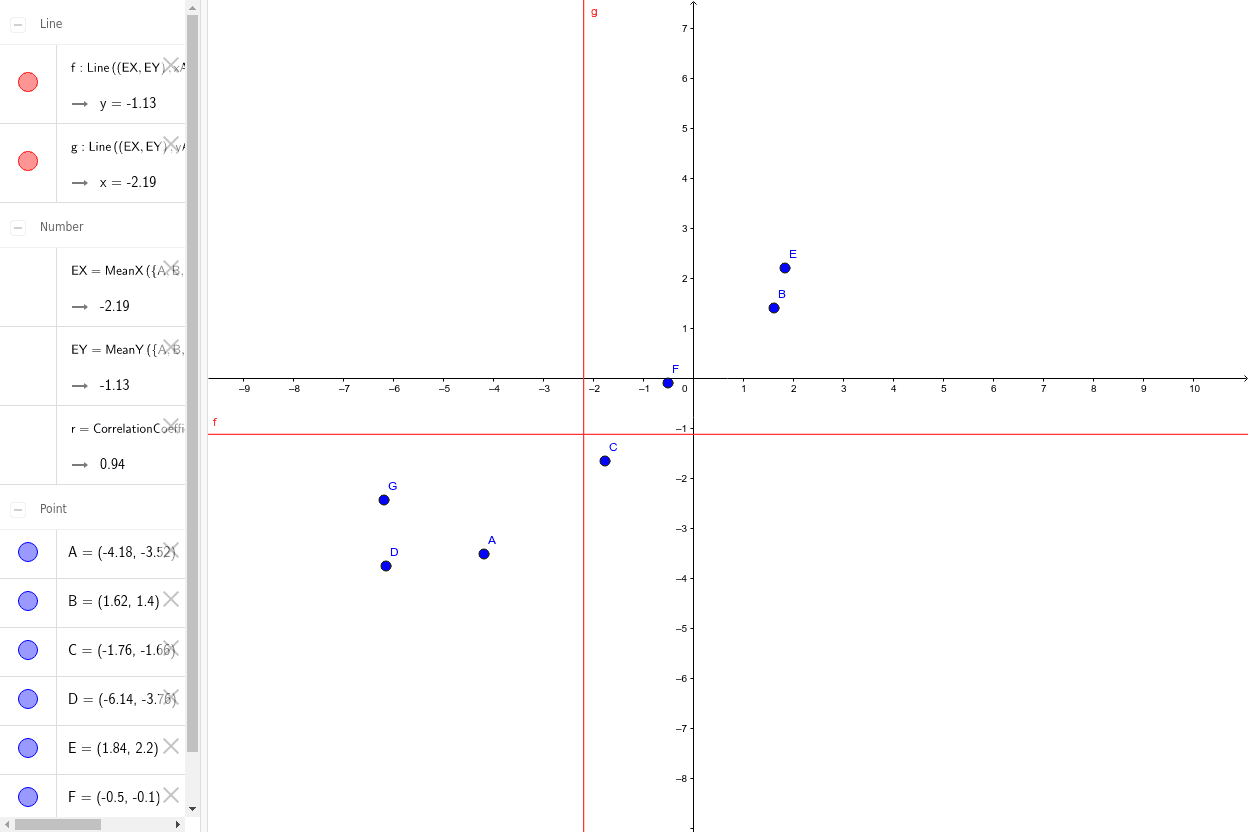
This example demonstrates how to visualize data correlation through scatter plots and draw a linear regression line. Core math concepts include Pearson's correlation coefficient (PMCC), linear regression equation, and mean calculations. GeoGebra commands used are MeanX, MeanY for mean calculation, PMCC for correlation, and Line for regression line. Suitable for high school mathematics teaching, introducing data analysis and statistical modeling basics.
GeoGebra Commands & Parameters
MeanX({A, B, C, D, E, F, G}) → EXMeanY({A, B, C, D, E, F, G}) → EYPMCC({A, B, C, D, E, F, G}) → rLine((EX, EY), xAxis) → fLine((EX, EY), yAxis) → g