
Standardized Linear Regression
Loading the math board and drawing, please wait…
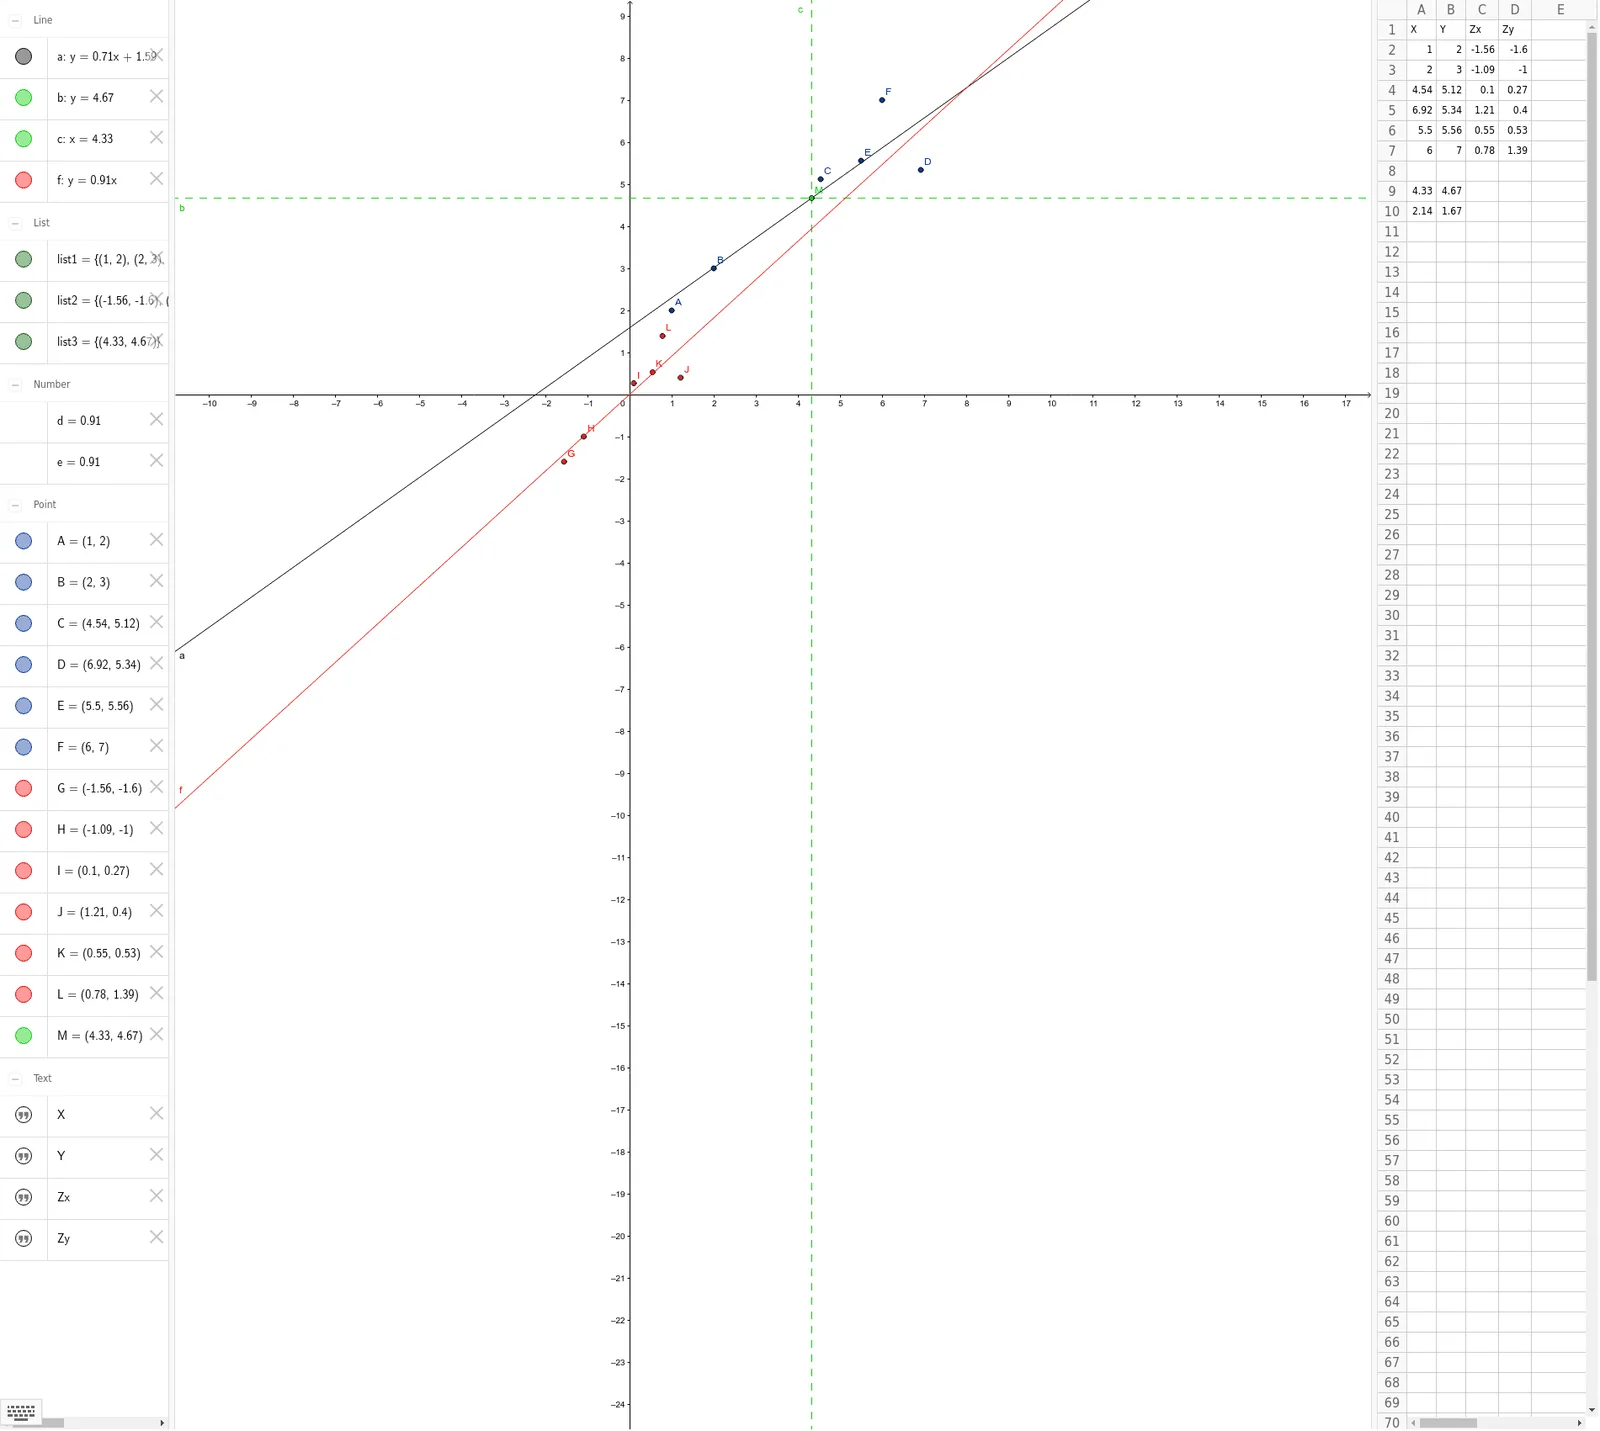
This example demonstrates the process of standardized linear regression. It involves key concepts of linear regression, such as calculating mean, standard deviation, and Pearson's correlation coefficient to build a linear regression model. Commands used include FitLineY, Mean, SD, Line, and PMCC. Suitable for high school mathematics education and learning linear regression analysis.
GeoGebra Commands & Parameters
FitLineY(list1) → aMean(A2:A7) → A9SD(A2:A7) → A10Mean(B2:B7) → B9SD(B2:B7) → B10Line(M, xAxis) → bLine(M, yAxis) → cFitLineY({G, H, I, J, K, L}) → fPMCC({A, B, C, D, E, F}) → dPMCC({G, H, I, J, K, L}) → e
AI Drawing Prompt Reference
Draw a coordinate system showing two sets of data points and their linear regression lines. First, calculate and draw the mean points and standard deviation lines for both datasets, perpendicular to the x-axis and y-axis. Then, calculate and draw two linear regression lines based on the original data points, one passing through the mean points. Finally, calculate and display the Pearson correlation coefficient between the two datasets.
The prompt above was compiled from the original drawing commands and is for reference only.