
Correlation Analysis: Scatter Plot and Geometric Transformations
Loading the math board and drawing, please wait…
In collections
Pearson Maths A level Further Statistics 2
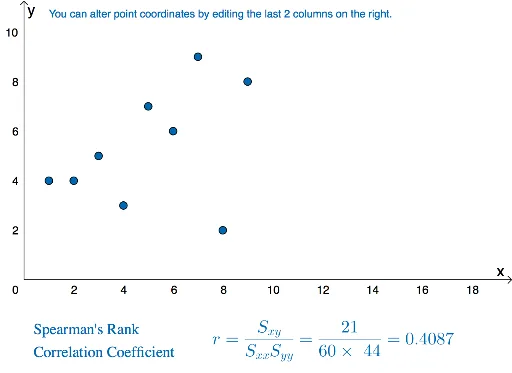
This example demonstrates how to analyze data correlation through scatter plots and visualize the relationship between centroids and variance using geometric transformations. Core mathematical concepts include scatter plots, Pearson's correlation coefficient (PMCC), variance, geometric transformations, and centroids. The construction leverages GeoGebra commands/objects like SXY, SXX, PMCC, n, B1-B9, C1-C9, A1-A9, L1-L3, sumxy, sumx, sumy, cor, b, and text elements. Suitable for high school mathematics or statistics courses, highlighting applications of data analysis and geometric transformations.
GeoGebra Commands & Parameters
SXY(L_{2}, L_{3}) → sumxySXX(L_{2}) → sumxSXX(L_{3}) → sumyPMCC(L_{1}) → b
AI Drawing Prompt Reference
Create a scatter plot to analyze data correlation and visualize the relationship between centroids and variance through geometric transformations. First, calculate the sum of x and y coordinates and their squares for all points, then use these values to compute the Pearson correlation coefficient, and finally label the coefficient value and centroid position on the plot to show data distribution and geometric transformation effects.
The prompt above was compiled from the original drawing commands and is for reference only.