
Coronavirus Growth Curve
Loading the math board and drawing, please wait…
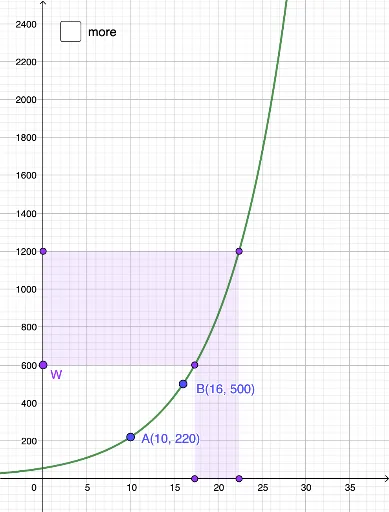
This example uses a logarithmic scale to demonstrate the growth trend of the coronavirus. Key mathematical concepts include logarithmic functions, exponential growth, and geometric means. Using GeoGebra commands such as Ray, Point, and OrthogonalLine, the example dynamically shows the growth of data points. Suitable for high school and above students to learn about exponential and logarithmic functions.
GeoGebra Commands & Parameters
Ray((0, 0), (0, 1)) → p_1Point(p_1) → WOrthogonalLine(W, yAxis) → hOrthogonalLine(D', yAxis) → iIntersect(f, i, (22.39821785166548, 1199.999999999991)) → FSegment(D', F) → lSegment(F, H) → nIntersect(f, h, (17.332466814232944, 599.9999999999953)) → ESegment(W, E) → jSegment(E, G) → mOrthogonalLine(I, yAxis) → pOrthogonalLine(J, yAxis) → qIntersect(f_{1}, p, 1) → KIntersect(f_{1}, q, 1) → LSegment(I, K) → rSegment(J, L) → sSegment(K, M) → tSegment(L, N) → aPolygon(W, D', F, H, G, E) → poly1, d, d', f_2, h_1, g_2, ePolygon(I, J, L, N, M, K) → poly2, i_1, j_1, l_1, n_1, m_1, k_1Intersect(g, i, (9.684983592469901, 1199.999999995298)) → DIntersect(g, h, (7.08082391870675, 599.9999999976491)) → OPolygon(W, D', D, S, R, O) → poly3, w, b, d_1, s_1, r_1, oIntersect(g_{1}, p) → TIntersect(g_{1}, q) → UPolygon(I, J, U, Z, V, T) → poly4, i_2, j_2, u, z_1, v, t_1
AI Drawing Prompt Reference
Draw a coronavirus growth curve on a logarithmic scale to demonstrate logarithmic functions, exponential growth, and geometric means. Start by drawing a vertical ray, marking its origin, and then creating two perpendicular lines to the y-axis. Intersect the curve with these lines at specific points and connect them to form polygons. Add more polygons to illustrate the dynamic growth of data points.
The prompt above was compiled from the original drawing commands and is for reference only.