
Coronavirus Cases in Azerbaijan and Models
Loading the math board and drawing, please wait…
In collections
Confirmed Coronavirus Cases in Countries
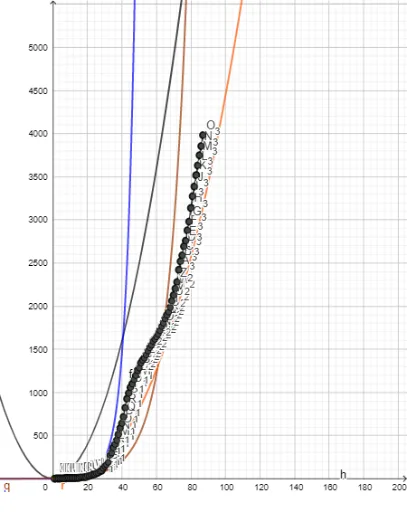
This example demonstrates the trend of coronavirus cases in Azerbaijan and various mathematical models. It involves core concepts like data visualization, statistical analysis, and function fitting. The construction uses the PolyLine command to plot data points and curves. Suitable for high school students and math enthusiasts learning data analysis and model building.
GeoGebra Commands & Parameters
PolyLine({A, B, C, D, E, F, G, H, I, J, K, L, M, N, O, P, Q, R, S, T, U, V, W, Z, A_1, B_1, C_1, D_1, E_1, F_1, G_1, H_1, I_1, J_1, K_1, L_1, M_1, N_1, O_1, P_1, Q_1, R_1, S_1, T_1, U_1, V_1, W_1, Z_1, A_2, B_2, C_2, D_2, E_2, F_2, G_2, H_2, I_2, J_2, K_2, L_2, M_2, N_2, O_2, P_2, Q_2, R_2, S_2, T_2, U_2, V_2, W_2, Z_2, A_3, B_3, C_3, D_3, E_3, F_3, G_3, H_3, I_3, J_3, K_3, L_3, M_3, N_3, O_3}) → f
AI Drawing Prompt Reference
Plot the trend of coronavirus cases in Azerbaijan with a polyline connecting points A to Z2, including three model curves from A1 to Z1, A2 to Z2, and A3 to Z3, to demonstrate data visualization, statistical analysis, and function fitting.
The prompt above was compiled from the original drawing commands and is for reference only.