
Copy of STATISTICS V1
Loading the math board and drawing, please wait…
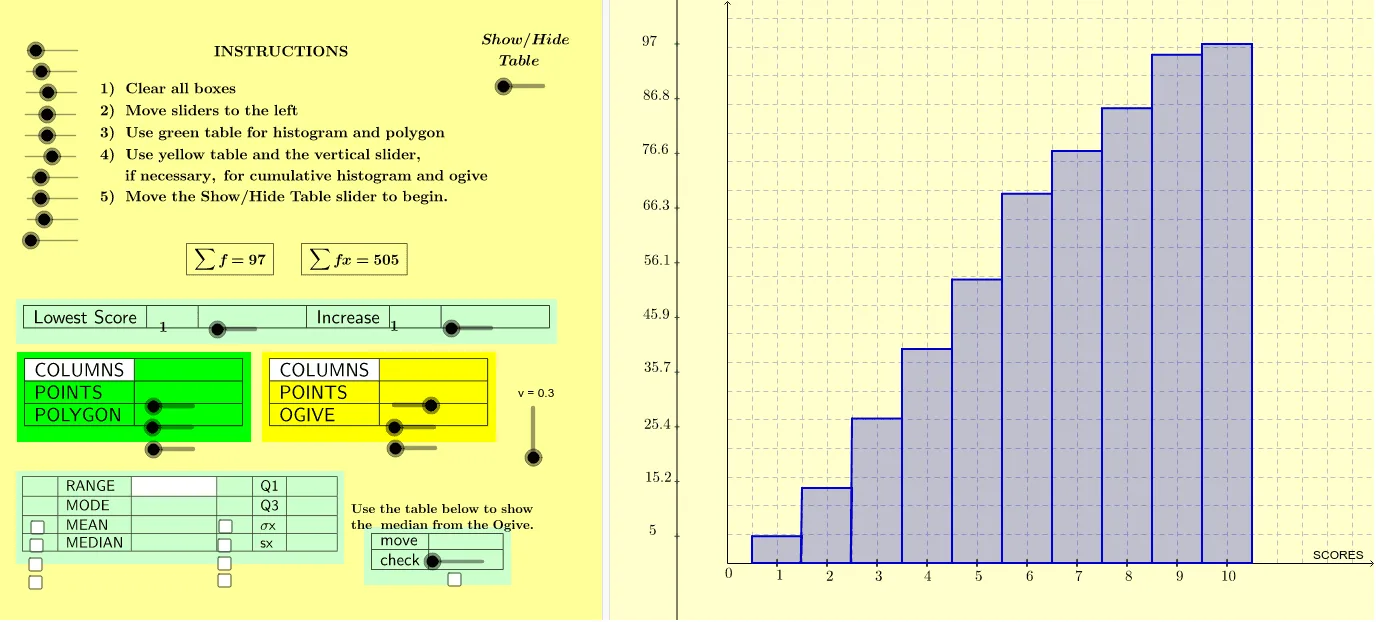
This example demonstrates the data processing process in STATISTICS V1. Core mathematical concepts include median, mode, mean, quartiles, and standard deviation. Using GeoGebra commands such as Sum, Median, Mean, Q1, Q3, and SD, the distribution characteristics of data can be intuitively displayed. Suitable for high school and above students or teachers.
GeoGebra Commands & Parameters
Sum(B2:B11) → B13Sum(C2:C11) → C13Polygon(O, P_1, Q_1, P) → poly5, o_2, p_1, q_1, pPolygon(P, R_1, S_1, Q) → poly6, p_2, r_1, s_1, qPolygon(Q, T_1, U_1, S) → poly7, q_2, t_1, u_1, sPolygon(S, V_1, W_1, R) → poly8, s_2, v_1, w_1, rPolygon(R, Z_1, A_2, T) → poly9, r_2, z_1, a_2, tPolygon(T, B_2, C_2, U) → poly10, t_2, b_2, c_2, uPolygon(S_2, G_3, H_3, T_2) → poly12, s_3, g_3, h_3, t_3Polygon(T_2, I_3, J_3, U_2) → poly13, t_4, i_3, j_3, u_2Polygon(U_2, K_3, L_3, V_2) → poly14, u_3, k_3, l_3, v_2Polygon(V_2, M_3, N_3, W_2) → poly15, v_3, m_3, n_3, w_2Polygon(W_2, O_3, P_3, Z_2) → poly16, w_3, o_3, p_3, z_2Polygon(Z_2, Q_3, R_3, A_3) → poly17, z_3, q_3, r_3, a_3Polygon(A_3, S_3, T_3, B_3) → poly18, a_4, s_4, t_5, b_3Polygon(B_3, U_3, V_3, C_3) → poly19, b_4, u_4, v_4, c_3Polygon(C_3, W_3, Z_3, D_3) → poly20, c_4, w_4, z_4, d_3Polygon(D_3, B_4, A_4, E_3) → poly21, d_1, b_5, a_5, e_3IterationList(f, A2, f_1 - 1) → list2IterationList(g, A3, f_2 - 1) → list3IterationList(h, A4, f_3 - 1) → list4IterationList(i, A5, f_4 - 1) → list5IterationList(j, A6, f_5 - 1) → list6IterationList(k, A7, f_6 - 1) → list7IterationList(l, A8, f_7 - 1) → list8IterationList(m, A9, f_8 - 1) → list9IterationList(n, A10, f_9 - 1) → list10IterationList(o, A11, f_10 - 1) → list11Join({list2, list3, list4, list5, list6, list7, list8, list9, list10, list11}) → list12Median(list12) → MEDIANPolygon(U_2, L_1, M_1, V_2) → poly3, u_6, l_1, m_1, v_5Polygon(V_2, N_1, O_1, W_2) → poly4, v_6, n_1, o_1, w_5Distance(M, E) → MEMode(list12) → MODEDistance(M, O) → MOMean(list12) → MEANDistance(R, A) → RAQ1(list12) → LQQ3(list12) → UQDistance(I_4, Q) → IQSD(list12) → SDOrthogonalLine(MOVE, yAxis) → p_4Distance(S, T) → STIntersect(e_1, yAxis) → F_3Polygon(T_2, L, K_1, U_2) → poly2, t_6, l_5, k_1, u_5Polygon(S_2, H_1, I, T_2) → poly22, s_5, h_1, i_1, t_7Segment(D_2, B_1) → cSegment(B_1, C_1) → dSegment(C_1, D_1) → a_1Segment(D_1, E_1) → b_1Segment(E_1, F_1) → c_1Segment(F_1, G_1) → g_1Segment(G_1, E_2) → j_1Segment(E_2, F_2) → d_2Segment(F_2, G_2) → e_2Segment(G_2, H_2) → g_2Segment(H_2, A_1) → g_5Segment(K, H) → eSegment(H, J_3) → h_2Segment(J_3, L_3) → i_2Segment(L_3, N_3) → k_2Segment(N_3, P_3) → l_2Segment(P_3, R_3) → m_2Segment(R_3, T_3) → n_2Segment(T_3, V_3) → d_4Segment(V_3, Z_3) → e_4Segment(Z_3, A_4) → g_4Stretch(S_2, xAxis, 2) → I_1Stretch(H_1, xAxis, 2) → J_1Stretch(I, xAxis, 2) → I'Stretch(T_2, xAxis, 2) → E_4Stretch(S_2, xAxis, v) → F_4Stretch(H_1, xAxis, v) → G_4Stretch(I, xAxis, v) → I'_1Stretch(T_2, xAxis, v) → H_4Stretch(T_2, xAxis, v) → J_4Stretch(L, xAxis, v) → L'Stretch(K_1, xAxis, v) → K_4Stretch(U_2, xAxis, v) → L_4Stretch(S_2, xAxis, v) → M_4Stretch(G_3, xAxis, v) → N_4Stretch(H_3, xAxis, v) → O_4Stretch(T_2, xAxis, v) → P_4Polygon(M_4, N_4, O_4, P_4) → poly12', m_5, n_5, o_4, p_5Stretch(T_2, xAxis, v) → Q_4Stretch(I_3, xAxis, v) → R_4Stretch(J_3, xAxis, v) → S_4Stretch(U_2, xAxis, v) → T_4Polygon(Q_4, R_4, S_4, T_4) → poly13', q_4, r_5, s_6, t_8Stretch(U_2, xAxis, v) → U_4Stretch(K_3, xAxis, v) → V_4Stretch(L_3, xAxis, v) → W_4Stretch(V_2, xAxis, v) → Z_4Polygon(U_4, V_4, W_4, Z_4) → poly14', u_7, v_7, w_6, z_6Stretch(V_2, xAxis, v) → A_5Stretch(M_3, xAxis, v) → B_5Stretch(N_3, xAxis, v) → C_5Stretch(W_2, xAxis, v) → D_5Polygon(A_5, B_5, C_5, D_5) → poly15', a_6, b_6, c_6, d_6Stretch(W_2, xAxis, v) → E_5Stretch(O_3, xAxis, v) → F_5Stretch(P_3, xAxis, v) → G_5Stretch(Z_2, xAxis, v) → H_5Polygon(E_5, F_5, G_5, H_5) → poly16', e_6, f_{10}, g_6, h_5Stretch(S_2, xAxis, v) → I_5Stretch(G_3, xAxis, v) → J_5Stretch(H_3, xAxis, v) → K_5Stretch(T_2, xAxis, v) → L_5Stretch(Z_2, xAxis, v) → M_5Stretch(Q_3, xAxis, v) → N_5Stretch(R_3, xAxis, v) → O_5Stretch(A_3, xAxis, v) → P_5Polygon(M_5, N_5, O_5, P_5) → poly17', m_6, n_6, o_5, p_6Stretch(A_3, xAxis, v) → Q_5Stretch(S_3, xAxis, v) → R_5Stretch(T_3, xAxis, v) → S_5Stretch(B_3, xAxis, v) → T_5Polygon(Q_5, R_5, S_5, T_5) → poly18', q_5, r_6, s_7, t_9Stretch(B_3, xAxis, v) → U_5Stretch(U_3, xAxis, v) → V_5Stretch(V_3, xAxis, v) → W_5Stretch(C_3, xAxis, v) → Z_5Polygon(U_5, V_5, W_5, Z_5) → poly19', u_8, v_8, w_7, z_7Stretch(C_3, xAxis, v) → A_6Stretch(W_3, xAxis, v) → B_6Stretch(Z_3, xAxis, v) → C_6Stretch(D_3, xAxis, v) → D_6Polygon(A_6, B_6, C_6, D_6) → poly20', a_7, b_7, c_7, d_7Stretch(D_3, xAxis, v) → E_6Stretch(B_4, xAxis, v) → F_6Stretch(A_4, xAxis, v) → G_6Stretch(E_3, xAxis, v) → H_6Polygon(E_6, F_6, G_6, H_6) → poly21', e_7, f_{11}, g_7, h_6Stretch(C_3, xAxis, v) → I_6Stretch(W_3, xAxis, v) → J_6Stretch(Z_3, xAxis, v) → K_6Stretch(D_3, xAxis, v) → L_6Polygon(I_6, J_6, K_6, L_6) → poly20'_1, i_6, j_6, k_6, l_7Stretch(H, xAxis, v) → H'Segment(K, H') → h_4Segment(H', S_4) → i_5Segment(S_4, W_4) → j_5Segment(W_4, C_5) → k_5Segment(C_5, G_5) → l_6Segment(G_5, O_5) → q_6Segment(O_5, S_5) → h_7Segment(S_5, W_5) → i_7Segment(W_5, K_6) → j_7Segment(K_6, G_6) → k_7OrthogonalLine(H', yAxis) → m_7OrthogonalLine(S_4, yAxis) → n_7OrthogonalLine(W_4, yAxis) → p_7OrthogonalLine(C_5, yAxis) → q_7OrthogonalLine(G_5, yAxis) → r_7OrthogonalLine(O_5, yAxis) → a_8OrthogonalLine(S_5, yAxis) → b_8OrthogonalLine(W_5, yAxis) → c_8OrthogonalLine(K_6, yAxis) → d_8OrthogonalLine(G_6, yAxis) → e_8Stretch(C_4, xAxis, v) → W_6Stretch(MOVE, xAxis, v) → MOVE'Vector(MOVE', W_6) → wOrthogonalLine(B_1, yAxis) → d_5OrthogonalLine(C_1, yAxis) → g_8OrthogonalLine(D_1, yAxis) → h_8OrthogonalLine(E_1, yAxis) → i_8OrthogonalLine(F_1, yAxis) → j_8OrthogonalLine(G_1, yAxis) → k_8OrthogonalLine(E_2, yAxis) → l_8OrthogonalLine(F_2, yAxis) → m_8OrthogonalLine(G_2, yAxis) → n_8OrthogonalLine(H_2, yAxis) → p_8TableText({{B15, C15}, {B16, C16}, {B17, C17}}, "|_") → text45TableText({{B19, C19, D19, E19, F19, G19}, {B20, C20, D20, E20, F20, G20}, {B21, C21, D21, E21, F21, G21}, {B22, C22, D22, E22, F22, G22}}, "|_") → text48OrthogonalLine(W_6, xAxis) → q_8Intersect(q_8, xAxis) → K_7Point(q_8) → L_7Vector(L_7, K_7) → zTableText({{A25, B25, C25, D25, E25, F25}}, "|_") → text47TableText({{C12}}, "|_") → text51Sequence(Cell[j, 1], j, 1, Fx) → list30Sequence(Cell[j, 2], j, 1, Fx) → list31Sequence(Cell[j, 3], j, 1, Fx) → list32Sequence(Cell[j, 4], j, 1, Fx) → list33Sequence(Cell[j, 5], j, 1, Fx) → list34Sequence(Cell[j, 6], j, 1, Fx) → list35Sequence(Cell[j, 7], j, 1, Fx) → list36Sequence(Cell[j, 8], j, 1, Fx) → list37Sequence(Cell[j, 9], j, 1, Fx) → list38Sequence(Cell[j, 10], j, 1, Fx) → list39Sequence(Cell[j, 11], j, 1, Fx) → list40TableText({list30, list31, list32, list33, list34, list35, list36, list37, list38, list39, list40}, "c_|") → text52TableText({{B12}}, "|_") → text50TableText({{A27, B27}, {A28, B28}}, "|_") → text54TableText({{D15, E15}, {D16, E16}, {D17, E17}}, "|_") → text24SampleSD(list12) → samplesd
AI Drawing Prompt Reference
Draw a set of statistical graphics for a dataset, including median, mode, mean, quartiles, and standard deviation. Start by plotting the data points, then calculate and mark the positions of median, mode, mean, quartiles, and standard deviation, and finally use polygons to connect these points and show the distribution characteristics of the data.
The prompt above was compiled from the original drawing commands and is for reference only.