
Contour Diagrams: Visualizing Function Level Curves and Mathematical Concepts
Loading the math board and drawing, please wait…
In collections
MATH1052-edX
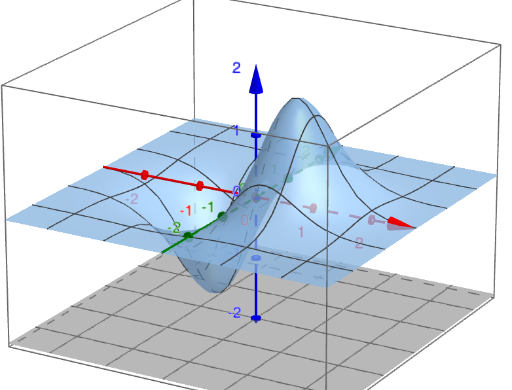
Contour Diagrams demonstrates the visualization of function level curves, involving calculus concepts such as function graphs, geometry principles of level curves, and probability statistics concepts like confidence intervals. Construction involves GeoGebra commands like Function, Textfield, Setup, f, F, InputBoxF, kmin, kmax, step, k, InpMin, InpMax, InpStep, c, c0, p, map, col, s, v, SetColors, a. Suitable for high school students or college undergraduates learning function graphs and geometric analysis.
GeoGebra Commands & Parameters
Function(f(x, y), -3, 3, -3, 3) → FTextfield(f) → InputBoxFTextfield(kmin) → InpMinTextfield(kmax) → InpMaxTextfield(step) → InpStep
AI Drawing Prompt Reference
Create a contour plot of a 3D function with the expression f(x, y), where x and y range from -3 to 3. Set the minimum value kmin, maximum value kmax, and step size step using input boxes to adjust the contour lines.
The prompt above was compiled from the original drawing commands and is for reference only.