
Continuity: An Intuitive Illustration of the Definition Using Accessible Languag
Loading the math board and drawing, please wait…
In collections
AP Calculus AB Applet Collection
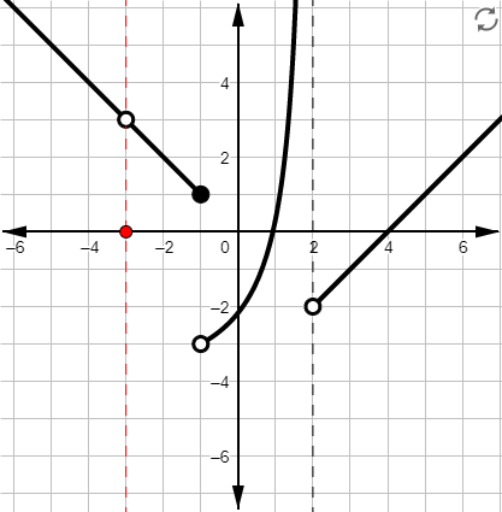
① This GeoGebra example dynamically illustrates the definition of continuity at a point, showing how function values behave as the input approaches a target value. ② The core mathematical concept is continuity, involving limits, left-hand and right-hand limits, and the condition that the limit equals the function value at that point. ③ Construction highlights: using Point and Vector commands, the applet defines a function f and multiple points such as Pn1hole, Pn3hole, Pn3Inside, Pa, a, b, along with auxiliary lines PL, PR, YL, YR, xline, Py, xLline, xRline to visualize the approaching process. Checkboxes chkShowL and chkShowR toggle left/right limit displays, while text labels txtL, txtR, txtLimR, txtLim, txtFofA, txtLimL, txtAt explain the relationship between limits and function values. ④ Suitable for high school and early college calculus students, this interactive tool helps demystify the formal definition of continuity and serves as an effective classroom demonstration for teachers.
GeoGebra Commands & Parameters
Point(xAxis) → PaVector(YL, (0, y(YL))) → YLvecVector(YR, (0, y(YR))) → YRvecVector(Py, (0, y(Py))) → Yvec