
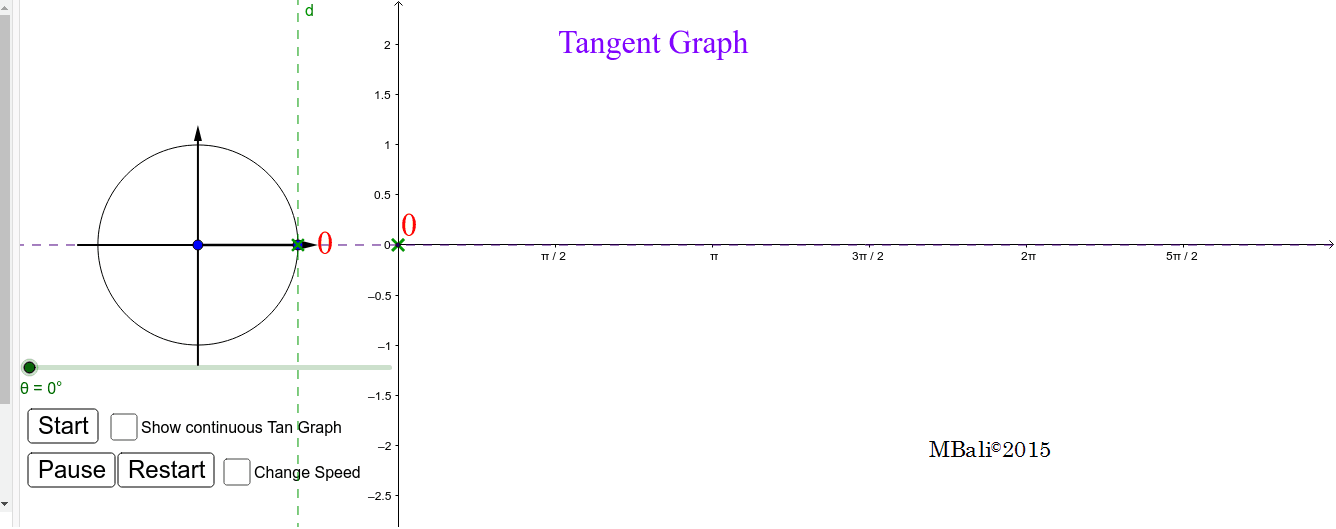
Constructing the Tan Graph
Loading the math board and drawing, please wait…
In collections
Strand 2: Geometry and Trigonometry
This example demonstrates how to visually construct the tangent function graph by dynamically plotting points on a unit circle and their corresponding segments, illustrating the geometric basis of the tangent function. Key math concepts include the unit circle, trigonometric definitions, geometric meaning of tangent values, and symmetry properties of the function graph. GeoGebra commands/objects used in construction are Circle, Vector, Rotate, Angle, Segment, Line, Intersect, and Midpoint. Suitable for high school students to understand the origin of the tangent function graph and for teaching continuity and periodicity in calculus.
GeoGebra Commands & Parameters
Circle(A, 1) → cVector(A - (1.2, 0), A + (1.2, 0)) → uVector(A - (0, 1.2), A + (0, 1.2)) → vRotate((-1, 0), θ, A) → BAngle((-1, 0), A, B) → αSegment(A, B) → aLine(A, B) → bLine((-1, 0), (-1, 1)) → dLine(B, D) → eIntersect(b, d) → ESegment((-1, 0), E) → fMidpoint(f) → GSegment(C, F) → iSegment(A, E) → jLine((π / 2, 0), x = 0) → kLine(((3 * π / 2), 0), x = 0) → l