
Constant Function by Jan Mays
Loading the math board and drawing, please wait…
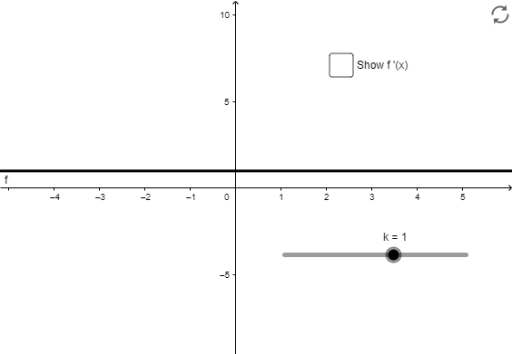
This example demonstrates the graph of a constant function. A constant function is a basic type of function in mathematics where the function value does not change with the variable. Using the k object in GeoGebra, we can visually see the graph of a constant function. The f and g objects in the construction summary further illustrate the properties of constant functions, while the b object is used to adjust the function value. Suitable for students at the junior high school level and above to learn about the basic concepts of functions.
GeoGebra Commands & Parameters
Numeric k(1)f(x) = kg(x) = f'(x)Boolean b(false)
AI Drawing Prompt Reference
Draw the graph of a constant function to show that the function value does not change with the variable. Include a adjustable constant to demonstrate the function graph, and add a辅助线 to illustrate the derivative is zero, suitable for junior high school students and above to learn basic function concepts.
The prompt above was compiled from the original drawing commands and is for reference only.