
Confidence Interval for a Proportion Exploration
Loading the math board and drawing, please wait…
In collections
Confidence Intervals
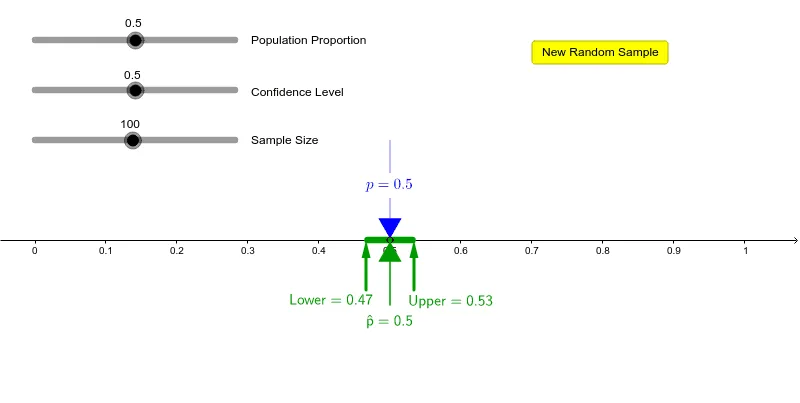
This example demonstrates how to explore a single confidence interval for a proportion (1-proportion z-interval) using GeoGebra. Key math concepts include confidence intervals, proportions, and normal distribution. Construction involves commands like Segment, Point, Vector, and objects such as p (proportion), confidence (level), zstar (critical value), and n (sample size). Suitable for high school and above students learning statistical inference and visualization of confidence intervals.
GeoGebra Commands & Parameters
Segment(A, A + (0, 2)) → cSegment(G, H) → bPoint(c) → ISegment(J, E) → dVector(K, C) → uVector(L, D) → v
AI Drawing Prompt Reference
Draw a diagram showing a confidence interval for a proportion, including a horizontal segment with two vertical segments intersecting it at the midpoint, forming a rectangle. Add a square above the horizontal segment and plot a normal distribution curve to illustrate the concept of confidence intervals.
The prompt above was compiled from the original drawing commands and is for reference only.