
Concept of Confidence Intervals by Heather Pierce
Loading the math board and drawing, please wait…
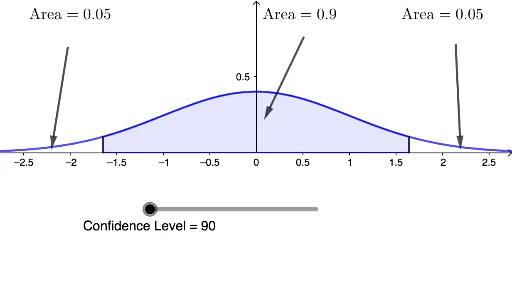
This example demonstrates the basic concept and graphical representation of confidence intervals. The core mathematical concept involved is the confidence interval in probability and statistics, visually showing the construction process of the interval. Key construction points include using the InverseNormal command to calculate percentiles, Segment and Vector commands to draw intervals and vectors, and the Integral command to compute areas, along with the collaborative use of objects f, cl, area, a, b, g, h, cl2, text1, A, B, u, text2, text3, C, D, v, E, F, w, c. Suitable for high school and above students to learn and understand confidence intervals in statistical inference.
GeoGebra Commands & Parameters
InverseNormal(0, 1, area) → aSegment((a, 0), (a, f(a))) → gSegment((b, 0), (b, f(b))) → hVector(A, B) → uVector(C, D) → vVector(E, F) → wIntegral(f, a, b) → c
AI Drawing Prompt Reference
Draw a function graph and display its confidence interval. First, calculate the percentiles of the normal distribution, then draw two vertical line segments to represent the upper and lower bounds of the confidence interval. Next, draw vectors from the origin to the function values, and compute the integral area of the function within the confidence interval. Finally, label the key information with text annotations.
The prompt above was compiled from the original drawing commands and is for reference only.