
Comprehensive Exploration of Tangent Function, Centroid, and Expected Value
Loading the math board and drawing, please wait…
In collections
Mapping Diagrams: From AB to C&DE, Resource
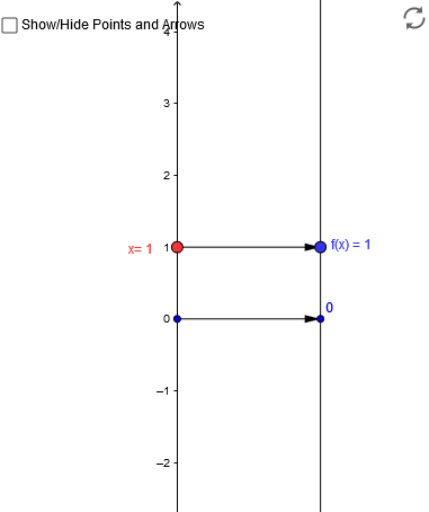
This GeoGebra example dynamically illustrates the tangent function graph alongside geometric points such as centroids and statistical concepts like expected value. Core mathematical concepts include the periodic nature and asymptotes of the tangent function, computation of centroids (barycenters), and expected value in combinatorics. Construction uses commands like Point, Vector, Textfield, and Sequence to create points, vectors, text boxes, and sequences. Objects include function f, points A, B, auxiliary points (A1-A10, B1-B10), centroids G1 and H1, and lists list1, list2, list3, with an input box for dynamic parameter adjustment. Suitable for high school to university level mathematics education, promoting cross-module understanding of functions, geometry, and probability/statistics.
GeoGebra Commands & Parameters
Point(yAxis) → AVector(A, B) → uTextfield(f) → inputBox1Sequence(Vector[(0, i), (2, f(i))], i, -4, 4, 1) → list2Sequence((i, f(i)), i, -4, 4, 1) → list3Vector((0, 0), (2, 0)) → v