
Complex Roots and Quartic Graphs
Loading the math board and drawing, please wait…
In collections
Modeling with Complex Numbers
Modeling with Complex Numbers
Modeling with Complex Numbers
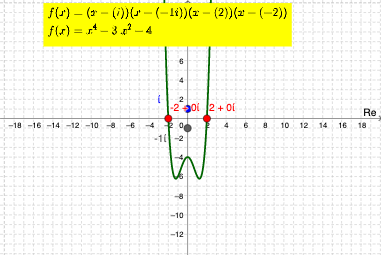
This example demonstrates how the quartic graph changes as you drag the two real roots (RED points) or one complex conjugate root (BLUE point). It involves core math concepts like complex numbers, function roots, conjugate complex numbers, and quartic function graph properties. Construction highlights include using Point, Mirror, Locus, and LaTeX commands. Suitable for high school mathematics teaching to understand the relationship between complex roots and function graphs.
GeoGebra Commands & Parameters
Point(xAxis) → EPoint(xAxis) → AMirror(B, xAxis) → B'Point(xAxis) → CLocus(D, C) → loc1LaTeX($1) → text2
AI Drawing Prompt Reference
Draw a graph of a quartic function with two real roots and a pair of conjugate complex roots. The real roots should be marked in red, and the complex roots in blue. The graph should show how the function shape changes as the real roots are moved. Construct by first placing the real roots, then mirroring to get the complex roots, and finally drawing the function curve.
The prompt above was compiled from the original drawing commands and is for reference only.