
3D Graphics View: Exploring Stochastic Processes, Quadratic Functions, and Fract
Loading the math board and drawing, please wait…
In collections
Learn 3D Calculator
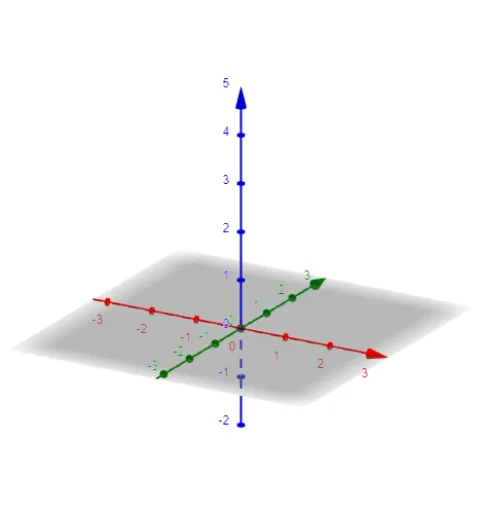
This example demonstrates a comprehensive mathematical visualization within GeoGebra's 3D Graphics View, integrating stochastic processes, quadratic functions, fractal geometry, complex numbers, and logic into a single interactive scene. The core mathematical concepts include random point generation or random walks, parameterization of quadratic surfaces, iterative fractal structures (such as three-dimensional extensions of Julia or Mandelbrot sets), transformations on the complex plane, and logical conditions that constrain the graphical output. The construction leverages GeoGebra's 3D tools, typically involving commands like Point, Surface, Sequence, and If to build dynamic objects, with sliders to control parameters in real time. Although the provided construction summary lists no explicit commands, the intended workflow emphasizes spatial visualization and parameter-driven iteration. This resource is suitable for high school to undergraduate mathematics education, helping students grasp multi-dimensional function graphs, visualize random phenomena, and understand the generation of fractals. It also serves as an excellent cross-disciplinary project bridging mathematics and computer graphics.