
Complex Roots and Cubic Graphs
Loading the math board and drawing, please wait…
In collections
Modeling with Complex Numbers
Modeling with Complex Numbers
Modeling with Complex Numbers
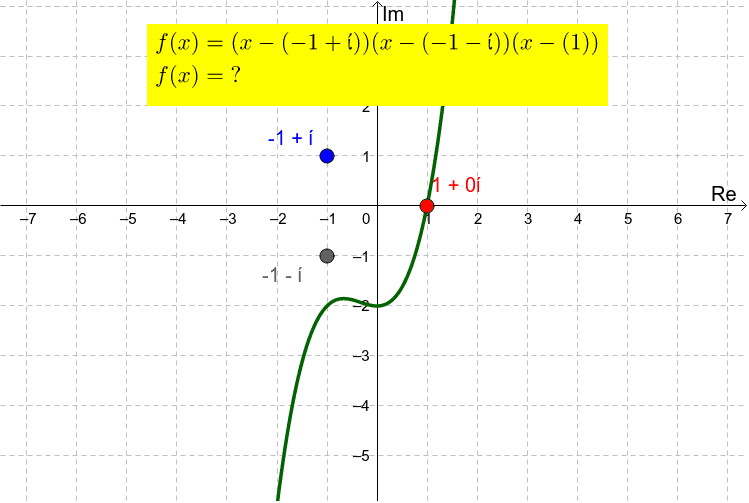
This GeoGebra example demonstrates how dragging the red real root point or the blue complex conjugate root point changes the cubic function graph. Key mathematical concepts include complex roots, function graph transformations, and geometric construction. Construction involves using GeoGebra commands like Point, Mirror, and Locus to create complex root points and their symmetric counterparts. Suitable for high school students or college freshmen to understand the relationship between complex numbers and function graphs, and to master dynamic geometric construction techniques.
GeoGebra Commands & Parameters
Point(xAxis) → AMirror(B, xAxis) → B'Point(xAxis) → CLocus(D, C) → loc1LaTeX($1) → text2
AI Drawing Prompt Reference
Draw a cubic function graph with a real root point and two conjugate complex root points. The real root point is on the x-axis, while the complex root points are symmetrically placed on opposite sides of the x-axis. The graph shows how the function curve changes with the real root point, and the complex root points maintain their symmetric relationship. Construct by first determining the real root point, then using symmetry to obtain the complex root points, and finally drawing the function curve to illustrate the relationship between the root points and the curve.
The prompt above was compiled from the original drawing commands and is for reference only.