
Complex Root Visualizer – Plot Polynomial Roots in the Complex Plane
Loading the math board and drawing, please wait…
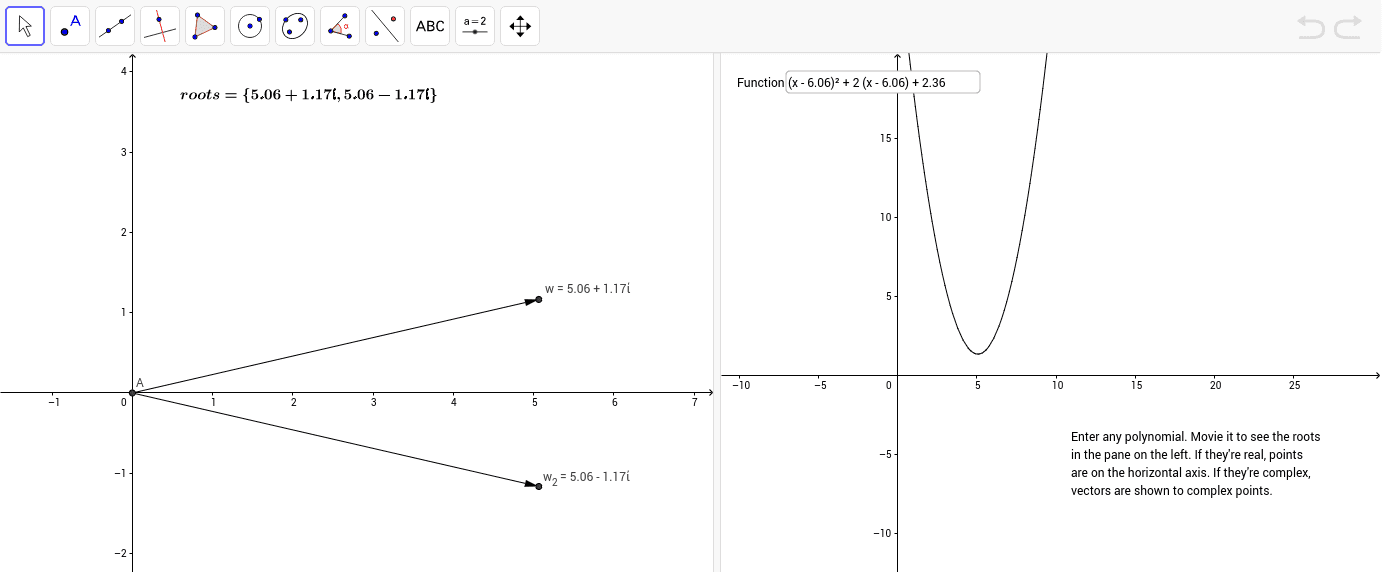
This example demonstrates how to visualize complex roots of a polynomial using GeoGebra. Enter any polynomial and the tool instantly computes and plots its roots in the complex plane. Key mathematical concepts include complex numbers, zeros of complex functions, and geometric distribution of roots. The construction uses the ComplexRoot command for root calculation, Intersect to locate root points, Vector for directional representation, and Textfield for user input. It is suitable for high‑school or early‑university algebra and complex analysis courses.
GeoGebra Commands & Parameters
ComplexRoot(f) → w, w_2, , , ,Intersect(xAxis, yAxis) → AVector(A, w) → uVector(A, w_2) → vTextfield(f) → inputBox1Intersect(f, y = 0) → B, C
AI Drawing Prompt Reference
Draw a graph showing the roots of a polynomial in the complex plane. Input a polynomial, and the tool will automatically compute and plot its roots. The roots are distributed in the complex plane, with the coordinate axes used for positioning. Use vectors to represent the direction from the origin to each root, and label the input polynomial on the axes. Ensure the graph is clear, with the relationship between the roots and the axes clearly shown, suitable for demonstrations in algebra and complex analysis courses.
The prompt above was compiled from the original drawing commands and is for reference only.