
Complex Points on the Graph of a Real Function
Loading the math board and drawing, please wait…
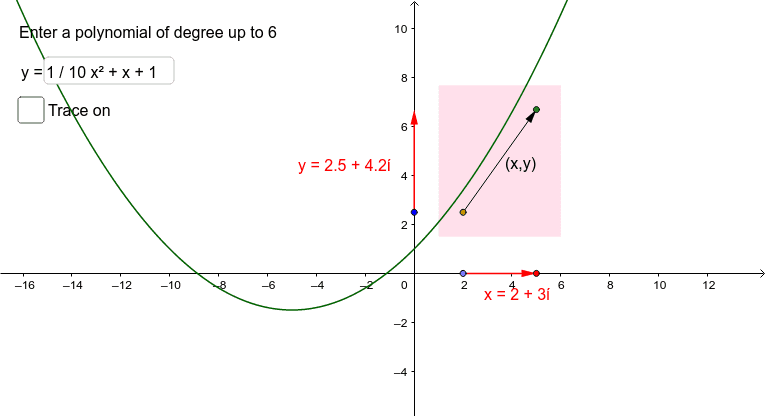
This example demonstrates the complex points on the graph of a real function. It involves the concept of complex numbers and uses GeoGebra commands such as Point, Vector, and Derivative to dynamically observe the changes in complex points. Suitable for high school mathematics education, particularly in coordinate geometry and complex numbers.
GeoGebra Commands & Parameters
Point(xAxis) → APoint(xAxis) → BVector((xr, 0), (xr + xi, 0)) → uDerivative(A1) → A2Derivative(A2) → A3Derivative(A3) → A4Derivative(A4) → A5Derivative(A5) → A6Derivative(A6) → A7Vector((0, yr), (0, yr + yi)) → vVector(D, D + u + v) → wPolygon(D + list1 + list2) → poly1Textfield(A1) → InputBox1
AI Drawing Prompt Reference
Draw the graph of a real function and mark the corresponding complex points. First, select two points A and B on the x-axis, then draw real number vectors u and imaginary number vectors v from A and B. Next, calculate the derivative sequence A2 to A7 of point A, and use these derivatives and vectors u and v to construct a vector w. Finally, use w and the combination of u and v to draw a polygon poly1, and add a text input box at point A1.
The prompt above was compiled from the original drawing commands and is for reference only.