
Complex Line with Real Slope: Linear Functions and Geometric Construction
Loading the math board and drawing, please wait…
In collections
Complex points using iplanes
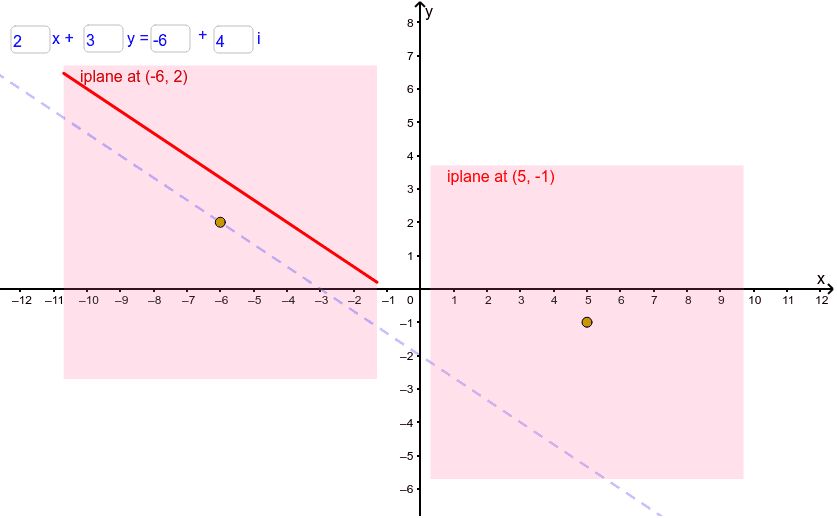
This GeoGebra example demonstrates drawing a line in the complex plane with a real slope, linking it to linear functions, circumcircles, and regression concepts. The core mathematical ideas include geometric representation of complex numbers, graphs of linear functions, the relationship between slope and variance, and the use of cosine in angle calculations. Construction highlights: using commands such as Polygon, Intersect, and Segment to build polygons and intersection points, Textfield and InputBox for interactive input, iplaneslice objects to define plane slices, and sliders or parameters to control the slope. Suitable for high school to university-level mathematics, this example helps students understand linear equations in the complex plane, the geometric meaning of linear regression, and dynamic parameterized construction in GeoGebra.
GeoGebra Commands & Parameters
Polygon(C + (iplaneslicesize * {(1, 1), (-1, 1), (-1, -1), (1, -1)})) → iplanesliceTextfield(ar) → InputBox1Textfield(br) → InputBox2Textfield(cr) → InputBox3Intersect(g, iplaneslice) → A, BSegment(A, B) → hPolygon(D + (iplaneslicesize * {(1, 1), (-1, 1), (-1, -1), (1, -1)})) → iplaneslice2Intersect(i, iplaneslice2) → E, FSegment(E, F) → jTextfield(ci) → InputBox4
AI Drawing Prompt Reference
Draw a line in the complex plane with a real slope, linking it to linear functions, circumcircles, and regression. Start by creating a square plane slice centered at a point to define the visible region. Then, use three interactive input fields to set real parameters controlling the line's intercept and slope. Find the intersection points of this line with the plane slice and connect them to form a segment representing the line. Create a second plane slice for another related line or auxiliary construction, find its intersections, and connect them. Finally, add an input field for an imaginary parameter to adjust the dynamic behavior. The figure emphasizes the geometric representation of complex numbers, the relationship between slope and variance, and the use of cosine in angle calculations.
The prompt above was compiled from the original drawing commands and is for reference only.