
Comparing Two Means
Loading the math board and drawing, please wait…
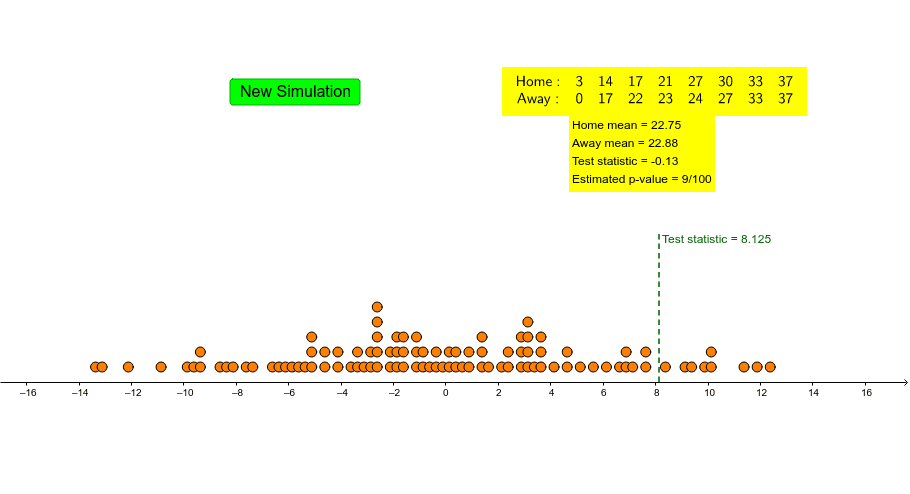
This example demonstrates how to compare the means of two sets of data. Key mathematical concepts include means, data processing, and statistical analysis. Using GeoGebra commands such as BoxPlot, Shuffle, and Take, the distribution of data can be dynamically displayed. Suitable for middle school and above students or teachers for teaching and learning statistics.
GeoGebra Commands & Parameters
BoxPlot(1, 0.5, away, true) → aBoxPlot(3, 0.5, home, true) → bShuffle(Join[{home, away}]) → list1Take(list1, 1, 8) → newhomeTake(list1, 9, 16) → newawayCountIf(x > -100, data) → eCountIf(x ≥ c, data) → fJoin({{"Home:"}, Sort[newhome]}) → list3Join({{"Away:"}, Sort[newaway]}) → list4TableText({list3, list4}, "c") → text1Segment((c, 0), (c, 3)) → gDotPlot(data, false, 0.3) → list2
AI Drawing Prompt Reference
Draw box plots for two sets of data, one for home and one for away. Mix and randomly shuffle the two sets, then take the first 8 and the next 8 as new home and away data respectively. Count how many numbers in each new set are less than -100 and greater than or equal to a value c. Sort and combine the two new sets into two rows of text. Draw a vertical line at value c. Finally, use a dot plot to show the distribution of all data.
The prompt above was compiled from the original drawing commands and is for reference only.