
Comparing Two Fractions: Geometric Construction and Function Graphs
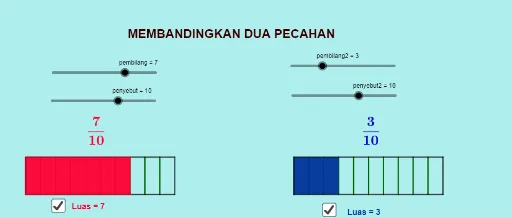
Loading the math board and drawing, please wait…
This example demonstrates how to compare two fractions using geometric constructions and function graphs. Key mathematical concepts include fractions, step functions, addition, correlation, standard deviation, and the Pythagorean theorem. Construction involves GeoGebra commands such as Intersect, Point, Segment, Sequence, and Polygon. Suitable for middle or high school mathematics education to understand the relationship between fractions, geometry, and functions.
GeoGebra Commands & Parameters
Intersect(xAxis, yAxis) → APoint(xAxis) → BPoint(yAxis) → CSegment(A, B) → fSegment(B, D) → gSegment(D, C) → hSegment(C, A) → iSequence(A + ((B - A) * t), t, 0, 1, 1 / penyebut) → L_1Sequence(C + ((D - C) * t), t, 0, 1, 1 / penyebut) → L_2Sequence(C + ((D - C) * t), t, 0, 1, 1 / penyebut) → L_3Sequence(Segment[Element[L_1, k], Element[L_2, k]], k, 1, penyebut) → L_4Sequence(Segment[Element[L_1, k], Element[L_2, k]], k, 1, penyebut) → L_5Point(Circle[A, a]) → EPolygon(A, E, F, C) → q1, a_1, e, f_1, cSequence(G + ((H - G) * t), t, 0, 1, 1 / penyebut2) → l1Sequence(I + ((J - I) * t), t, 0, 1, 1 / penyebut2) → l2Sequence(Segment[Element[l1, r], Element[l2, r]], r, 1, penyebut2) → l3Sequence(Segment[Element[l1, r], Element[l2, r]], r, 1, penyebut2) → l4Polygon(G, X, Y, I) → q2, g_1, x_1, y_1, i_1Segment(G, H) → jSegment(H, J) → kSegment(J, I) → lSegment(I, G) → m