
Comparing t-Distribution and Normal Distribution
Loading the math board and drawing, please wait…
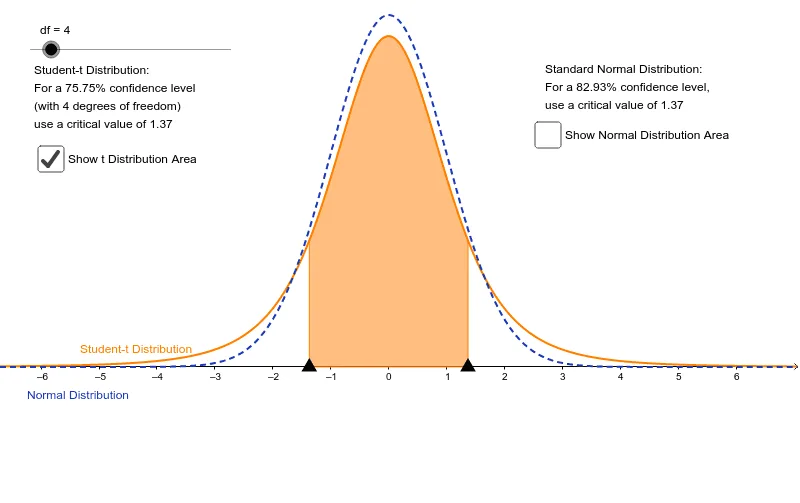
This example demonstrates the comparison of the shapes of the t-distribution and the Normal distribution by adjusting the degrees of freedom. Key math concepts include probability & statistics, distribution shapes, and critical values. It is constructed using GeoGebra commands like Point, DynamicCoordinates, and Integral, with objects such as df (degrees of freedom), A (point), f (function), B (point), a (value), C (point), D (point), g (function), b (value), aa (text), ab (text), text1 (text), text2 (text), c (value), and d (value). Suitable for high school and above students to understand statistical distribution properties and parameter effects.
GeoGebra Commands & Parameters
Point(xAxis) → ADynamicCoordinates(A, (-x(A)), y(A)) → BIntegral(f, x(A), x(B), true) → aPoint(xAxis) → CPoint(xAxis) → DIntegral(g, x(A), x(B), true) → b