
Comparing Situations by Ratios
Loading the math board and drawing, please wait…
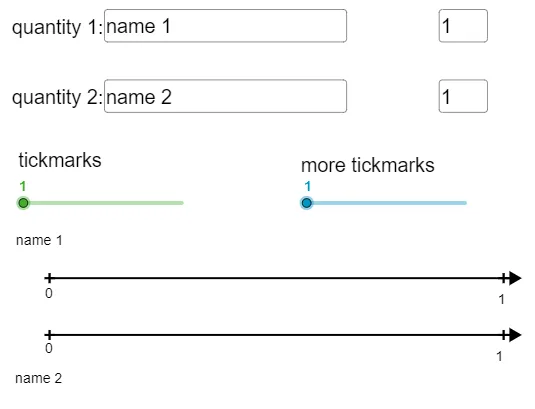
This example demonstrates comparing different geometric situations through ratios. Core math concepts include ratios, similarity transformations, and geometric constructions. It uses commands like Textfield, Point, Segment, GCD, Sequence in GeoGebra. Suitable for upper elementary or middle school students learning geometric transformations and ratio applications.
GeoGebra Commands & Parameters
Textfield(text4) → InputBox2Textfield(Q1Jump) → InputBox4Textfield(text5) → InputBox3Textfield(Q2Jump) → InputBox5Point(a) → DSegment(A, D) → cSegment(B, C) → dText("20%", (scale - 0.25, y(A) + yOffSet)) → text6Text(8, (scale - 0.12, y(B) + yOffSet)) → text7GCD(Q1Jump, Q2Jump) → gSegment(A, I) → iSegment(B, J) → kText(0, (x(A) - 0.12, y(A) - (1.2 * yOffSet))) → text2Sequence(((e * v), h), v, 0, f) → Q1marksSequence(((e * k), 0), k, 0, f) → Q2marksSequence(Text[(q * Q1Jump), ((e * q) + topxOffSet, y(B) + yOffSet)], q, 1, f) → TextQ1Sequence(Text[(p * Q2Jump), ((e * p) + xOffSet, y(A) + yOffSet)], p, 1, f) → TextQ2Sequence(Text[(q * Q1Jump / 2), ((e / 2 * q) + topxOffSet, y(B) + yOffSet)], q, 1, (f * 2)) → TextQ1split2Sequence(((e / 2 * l), h), l, 0, (f * 2)) → Q1split2Sequence(((e / 2 * k), 0), k, 0, (f * 2)) → Q2split2Sequence(Text[(p * Q2Jump / 2), ((e / 2 * p) + (1.1 * xOffSet), y(A) + yOffSet)], p, 1, (f * 2)) → TextQ2split2Text(0, (x(B) - 0.12, y(B) + (3.2 * yOffSet))) → text3Sequence(((e / s * l), h), l, 0, (f * s)) → Q1splitSequence(((e / s * k), 0), k, 0, (f * s)) → Q2splitSequence(Text[(q * Q1Jump / s), ((e / s * q) + topxOffSet, y(B) + yOffSet)], q, 1, (f * s)) → TextQ1splitSequence(Text[(p * Q2Jump / s), ((e / s * p) + xOffSet, y(A) + yOffSet)], p, 1, (f * s)) → TextQ2split
AI Drawing Prompt Reference
Draw a geometric diagram comparing two situations by ratios. Place two starting points on a horizontal baseline, extending two segments to the right to represent initial lengths of two scenarios. Mark each segment with equally spaced tick marks and label them with increasing numbers starting from zero. Above each segment, add text input boxes for two jump amounts. Based on the greatest common divisor of these jumps, subdivide each segment into smaller equal parts and display fractional labels. Below the diagram, annotate percentages like '20%' and '8', and indicate zero positions. The layout should clearly show the division and comparison of ratios.
The prompt above was compiled from the original drawing commands and is for reference only.