
Comparing Histogram, Dot and Stem & Leaf Diagrams
Loading the math board and drawing, please wait…
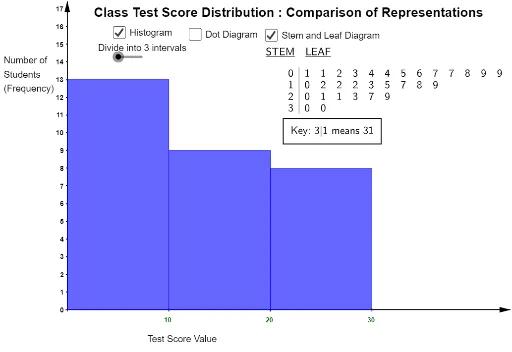
This example demonstrates how to represent a set of test scores using histogram, dot diagram, and stem and leaf diagram. It involves core math concepts like data visualization, probability & statistics, median value, and expected value. Constructed using GeoGebra commands/objects such as Length, StemPlot, DotPlot, Sequence, Histogram. Suitable for high school mathematics teaching to help students compare different data representation methods.
GeoGebra Commands & Parameters
Length(l1) → bStemPlot(l1) → text4DotPlot(l1, true, 3) → listdotdiagramSequence(i, i, 0, 30, 2.5) → l3Histogram(l3, l1, false) → histogram3Sequence(i, i, 0, 30, 30 / n) → l2Histogram(l2, l1, false) → histogram2Sequence((i - 1, 0), i, 1, 30 + 30 / n, 30 / n) → xticksSequence((i, 0), i, 1, 30) → xtickspSequence(Text[round(i, 1), (i - 0.2 - (0.2 * floor(lg(i))), -0.7)], i, 1, 30, 1) → xaxislblspSequence(Text[round(i, 1), (i + 0.25 - (0.7 * floor(lg(i + 1))), -0.7)], i, 30 / n, 30, 30 / n) → xaxislbls
AI Drawing Prompt Reference
Create a histogram, dot plot, and stem and leaf plot for a set of test scores. First, calculate the length of the dataset, then create a stem and leaf plot and a dot plot. Next, generate a sequence of interval boundaries and draw histograms. Finally, add axes, ticks, and labels to compare different data representation methods.
The prompt above was compiled from the original drawing commands and is for reference only.