
Comparing Fractions Using Number Lines and Circles by Karen Reyes
Loading the math board and drawing, please wait…
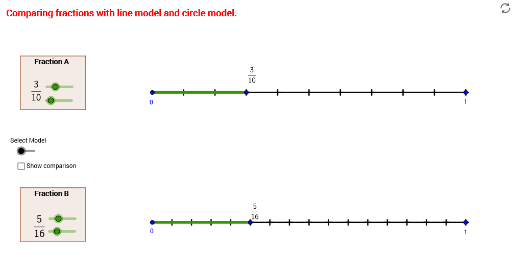
① This example visualizes fraction comparison using both number lines and circular sectors, helping learners intuitively grasp which fraction is larger. ② Core math concepts include fraction meaning, equivalent fractions, and comparing fractions with different denominators. ③ Construction highlights: uses Segment and Sequence to build number line ticks, Circle and Rotate to generate circular sectors, CircleSector to draw fraction wedges, Polygon for auxiliary shapes; sliders (denominator1, denominator2, numerator1, numerator2) allow dynamic adjustment, and boolean objects like showcomparison control the display of comparison results. ④ Suitable for upper elementary to middle school students learning fractions, and for teachers demonstrating geometric representations of fraction comparison in class.
GeoGebra Commands & Parameters
Segment(A, A + (unitsize1, 0)) → line1Segment(B, B + (unitsize2, 0)) → line2Sequence((x(A) + (i * unitsize1 / denominator1), y(A)), i, 1, denominator1) → numdots1Sequence((x(B) + (i * unitsize2 / denominator2), y(B)), i, 1, denominator2) → numdots2Segment(E, (x(E), y(E) - (y(A) - y(B)))) → showcomparison_1Segment(A, E) → showfrac1_1Segment(B, F) → showfrac2_1Circle(G, unitradius) → cPoint(c) → HSegment(G, H) → aRotate(G, (360 * ° / denominator1), G) → G'Sequence(Segment[Rotate[G, ((i * 360) * ° / denominator1), G], Rotate[H, ((i * 360) * ° / denominator1), G]], i, 1, denominator1) → denominatorwedges1Circle(I, unitradius) → dPoint(d) → JSegment(I, J) → bSequence(Segment[Rotate[I, ((i * 360) * ° / denominator2), I], Rotate[J, ((i * 360) * ° / denominator2), I]], i, 1, denominator2) → denominatorwedges2Rotate(H, ((numerator1 * 360) * ° / denominator1), G) → H'Rotate(J, ((numerator2 * 360) * ° / denominator2), I) → J'CircleSector(G, H, H') → numeratorwedge1CircleSector(I, J, J') → numeratorwedge2Polygon(K, (x(K), y(K) - boxheight), (x(K) + boxwidth, y(K) - boxheight), (x(K) + boxwidth, y(K))) → poly1, e, f, g, hPolygon(L, (x(L), y(L) - boxheight), (x(L) + boxwidth, y(L) - boxheight), (x(L) + boxwidth, y(L))) → poly2, l, i, j, k
AI Drawing Prompt Reference
Draw two horizontal number lines, each with tick marks divided into equal segments according to two adjustable denominators. Below the lines, place two circles of equal radius, each divided into sector wedges matching its denominator, with the numerator's wedge highlighted in a distinct color. Add two rectangular boxes to display comparison results or symbols. Arrange all elements neatly to visually compare the two fractions.
The prompt above was compiled from the original drawing commands and is for reference only.