
Comparing Fractions on a Number Line by Lillian Petersen
Loading the math board and drawing, please wait…
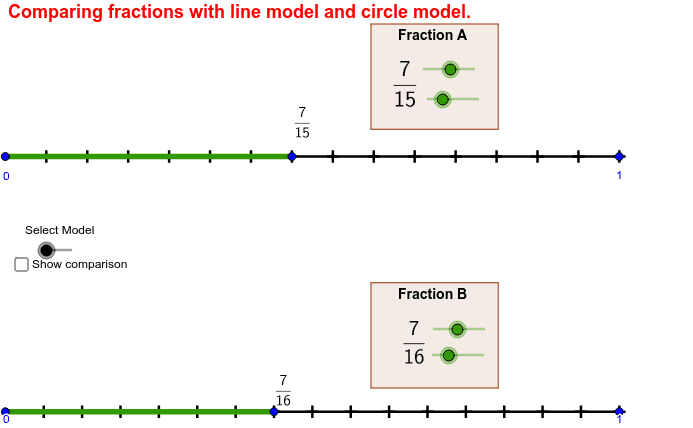
This example demonstrates comparing fractions on a number line. Key mathematical concepts include fractions and geometric construction. It uses Segment, Sequence, Circle, Point, Rotate, CircleSector, Polygon, etc., in GeoGebra. Suitable for upper elementary or middle school students to learn fraction comparison and geometric construction.
GeoGebra Commands & Parameters
Segment(A, A + (unitsize1, 0)) → line1Segment(B, B + (unitsize2, 0)) → line2Sequence((x(A) + i * unitsize1 / denominator1, y(A)), i, 1, denominator1) → numdots1Sequence((x(B) + i * unitsize2 / denominator2, y(B)), i, 1, denominator2) → numdots2Segment(E, (x(E), y(E) - (y(A) - y(B)))) → showcomparison_1Segment(A, E) → showfrac1_1Segment(B, F) → showfrac2_1Circle(G, unitradius) → cPoint(c) → HSegment(G, H) → aRotate(G, 360 * ° / denominator1, G) → G'Sequence(Segment[Rotate[G, i * 360 * ° / denominator1, G], Rotate[H, i * 360 * ° / denominator1, G]], i, 1, denominator1) → denominatorwedges1Circle(I, unitradius) → dPoint(d) → JSegment(I, J) → bSequence(Segment[Rotate[I, i * 360 * ° / denominator2, I], Rotate[J, i * 360 * ° / denominator2, I]], i, 1, denominator2) → denominatorwedges2Rotate(H, numerator1 * 360 * ° / denominator1, G) → H'Rotate(J, numerator2 * 360 * ° / denominator2, I) → J'CircleSector(G, H, H') → numeratorwedge1CircleSector(I, J, J') → numeratorwedge2Polygon(K, (x(K), y(K) - boxheight), (x(K) + boxwidth, y(K) - boxheight), (x(K) + boxwidth, y(K))) → poly1, e, f, g, hPolygon(L, (x(L), y(L) - boxheight), (x(L) + boxwidth, y(L) - boxheight), (x(L) + boxwidth, y(L))) → poly2, l, i, j, k
AI Drawing Prompt Reference
Draw a number line with two points A and B representing fractions. Use segments and points to show the comparison of fractions. Then, draw sector areas around points A and B to represent the size of each fraction. Finally, use rectangles to represent the comparison result, one for fraction A and another for fraction B, and compare their positions to visually show the size relationship between the fractions.
The prompt above was compiled from the original drawing commands and is for reference only.