
Comparing and Ordering Fractions
Loading the math board and drawing, please wait…
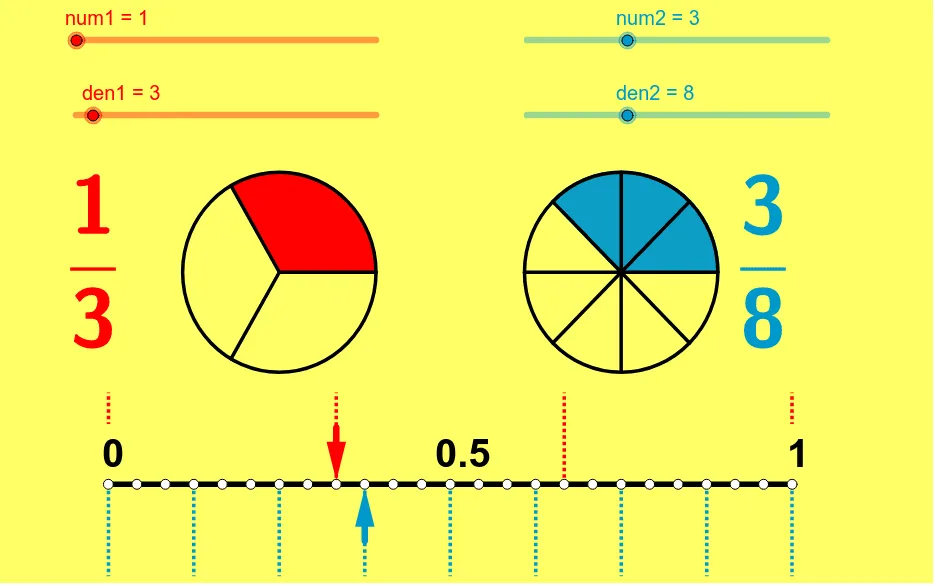
This example demonstrates how to visually compare and order fractions using GeoGebra. It involves core math concepts like fraction comparison, equivalent fractions, and least common multiple (LCM). Key GeoGebra commands used include Sequence, CircleSector, Segment, Vector, and LCM. Suitable for middle school and above, it aids in teaching fraction comparison with geometric intuition.
GeoGebra Commands & Parameters
Sequence((sqrt(2) * cos(i * 360 * ° / den1) + x(B), sqrt(2) * sin(i * 360 * ° / den1) + y(B)), i, 1, den1) → leftptsSequence((sqrt(2) * cos(i * 360 * ° / den2) + x(A), sqrt(2) * sin(i * 360 * ° / den2) + y(A)), i, 1, den2) → rightptsSequence(Segment[B, Element[leftpts, i]], i, 1, den1) → segleftSequence(Segment[A, Element[rightpts, i]], i, 1, den2) → segrightCircleSector(B, Element[leftpts, den1], Element[leftpts, num1]) → eCircleSector(A, Element[rightpts, den2], Element[rightpts, num2]) → fSegment(D, C) → aVector(F, E) → uVector(G, H) → vSequence((-5 + i * 10 / den1, 0), i, 0, den1) → list1Sequence((-5 + i * 10 / den1, 1.3), i, 0, den1) → list2Sequence(Segment[Element[list1, i], Element[list2, i]], i, 1, den1 + 1) → list3Sequence((-5 + i * 10 / den2, 0), i, 0, den2) → list4Sequence((-5 + i * 10 / den2, -1.3), i, 0, den2) → list5Sequence(Segment[Element[list4, i], Element[list5, i]], i, 0, den2 + 1) → list6LCM(den1, den2) → bSequence((-5 + i * 10 / b, 0), i, 0, b) → list7
AI Drawing Prompt Reference
Visually compare and order fractions using geometric constructions. Draw two concentric circles centered at points B and A, dividing each circle into segments based on two sliders den1 and den2. Represent fractions as sectors within the circles, with sizes determined by their numerators and denominators. Below the circles, draw two horizontal line segments in different colors to show the size relationship between the fractions. Finally, calculate the least common multiple of the denominators and draw a new horizontal line segment below to represent it.
The prompt above was compiled from the original drawing commands and is for reference only.