
Compare Two Normal Curves with 0<µ<5
Loading the math board and drawing, please wait…
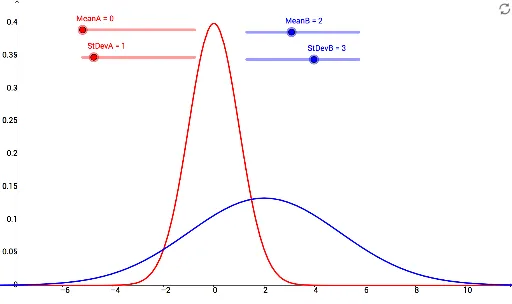
This example demonstrates two normal curves with means between 0 and 5. Key mathematical concepts include normal distribution, mean, and standard deviation. Using the GeoGebra command 'Normal', two normal distribution functions f and g are constructed. Suitable for high school mathematics education and learning about probability and statistics.
GeoGebra Commands & Parameters
Normal(MeanA, StDevA, x) → fNormal(MeanB, StDevB, x) → g
AI Drawing Prompt Reference
Draw two normal distribution curves, one with mean between 0 and 5, and another with a different mean. Adjust the mean and standard deviation using sliders to observe the changes in the curves.
The prompt above was compiled from the original drawing commands and is for reference only.